
10% Covered Call Resilience Test
How JEPQ, JEPI and XYLD behave across market cycles

They reassure with monthly payouts—yet unsettle with ever-changing amounts. Even more intriguing, they seem counter-cyclical and could potentially provide you with a higher income precisely when the market is in crisis. It’s this very paradox that has driven me to write so extensively about covered call ETFs since March.
Yet, the fundamental questions remain: Is there any erosion of the capital (NAV erosion)? Is the income truly as substantial as promised? And is the total return ultimately acceptable? These are the exact doubts that linger over my own positions in funds like JEPQ, JEPI, and XYLD. So, rather than staying in the realm of theory, let’s get practical: here are the concrete results of the combo strategy I use personally.
I/ The US Stress Test: JEPQ, JEPI and XYLD income engines
A/ Three different beasts for my income engine
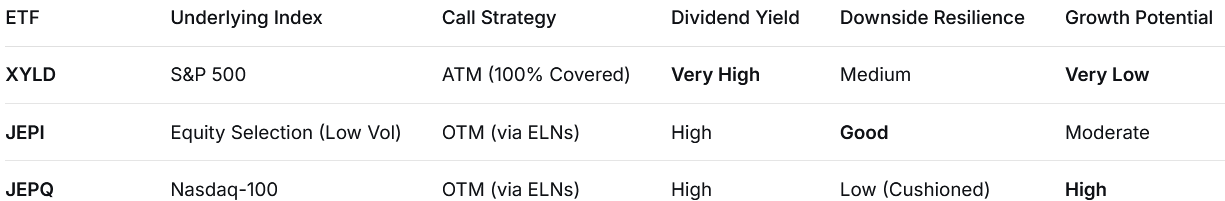
The core difference between these covered call ETFs lies in the trade-off they make between income, downside resilience, and growth potential. XYLD employs a purely systematic, high-income strategy by writing 100% At-The-Money (ATM) calls on the S&P 500. This provides substantial monthly yield but severely caps upside participation, leading to slower recovery after market downturns. In contrast, JEPI and its tech-focused sibling JEPQ use a more active, hybrid approach. By writing Out-of-The-Money (OTM) calls on a defensive equity selection (JEPI) or the Nasdaq-100 (JEPQ), they aim for a smoother income stream and greater resilience. JEPI’s defensive tilt offers better protection in a downturn, while JEPQ, though more volatile, uses its high yield to cushion falls while retaining significant growth potential.
This strategic divergence is clearly reflected in their risk-return profiles. XYLD is the quintessential income machine with limited growth. JEPI strikes a balance, offering a robust combination of yield, defense, and modest growth. JEPQ sits on the growth-oriented end of the spectrum, leveraging the tech sector’s potential and using option income to mitigate its inherent volatility. The choice ultimately depends on an investor’s priority: maximum income (XYLD), balanced total return (JEPI), or tech exposure with an income cushion (JEPQ).
B/ Income results
This week’s comparison focuses on three JP Morgan ETFs. This selection is intentional; not only do they represent distinct strategic approaches, but they are also accessible to a broad international audience, unlike many other covered call products. My analysis is grounded in a practical perspective, as I have personal investments in two of these U.S.-listed funds and a comparable European-domiciled ETF.
I have previously covered JEPQ extensively, from its initial introduction (here) to a deeper analysis of its role in a portfolio (here). While I will also be examining XYLD, my approach to it is more cautious, as its strategy presents a different risk-return profile that I find less aligned with my objectives.
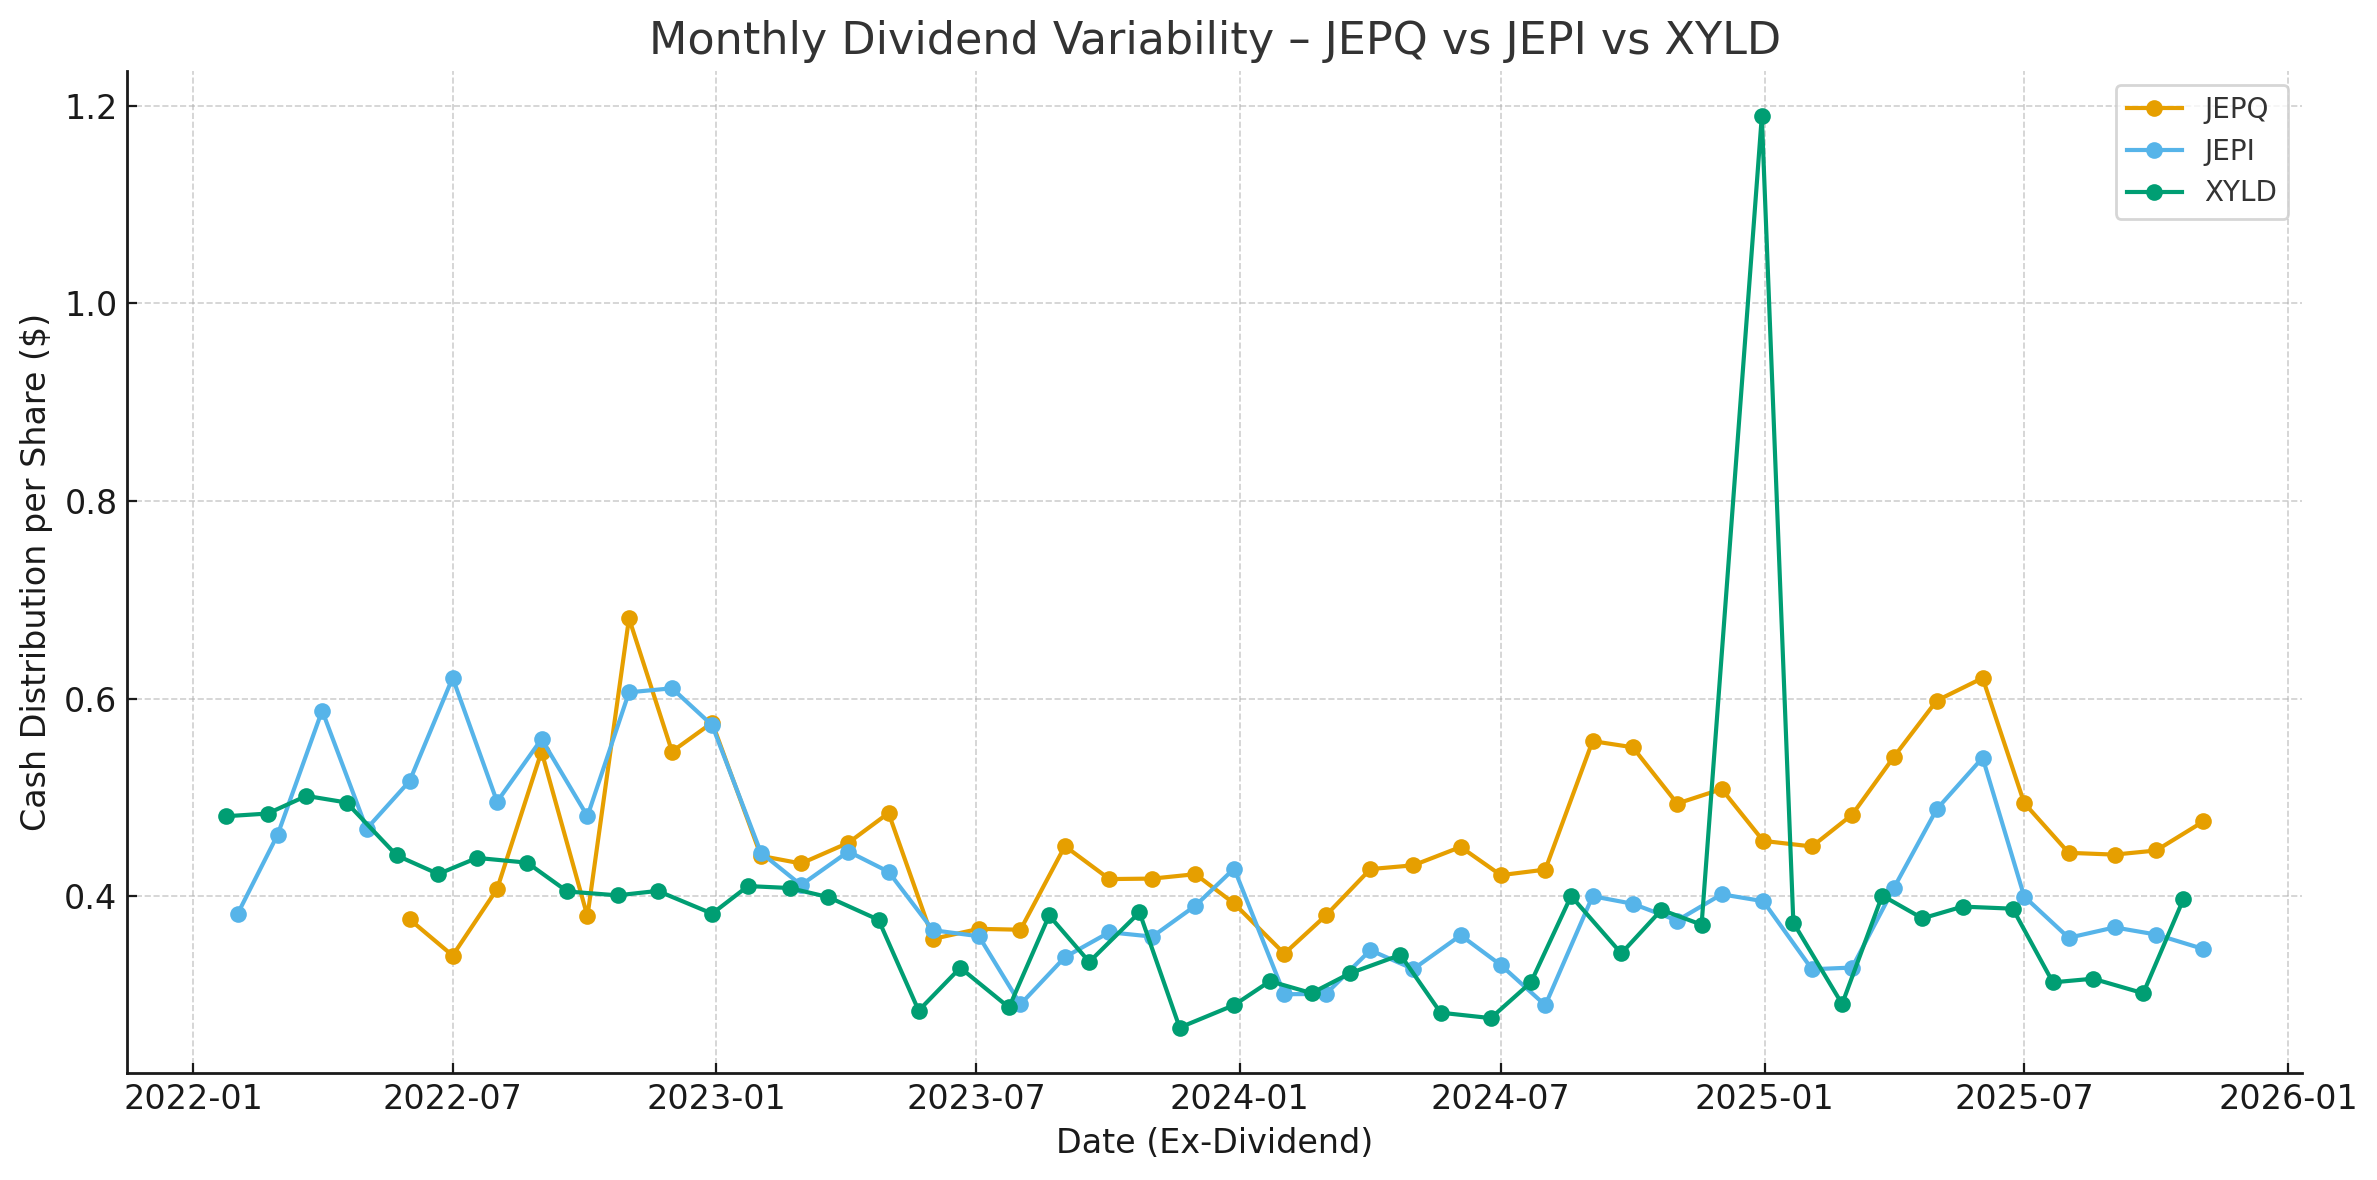
Over the past three years, dividend volatility has proven to be lowest for JEPI (σ = $0.09), slightly higher for JEPQ (σ = $0.08), and significantly more pronounced for XYLD (σ = $0.14). Behind these disparities lie three key factors: the underlying index, the degree of option coverage, and the hand of the manager. XYLD, anchored to the S&P 500 and fully covered, distributes exactly what the market provides—a lot when implied volatility soars, and very little when it subsides.
JEPI and JEPQ, in contrast, only partially cover their portfolios and blend stock dividends, option premiums, and active management. Their cash flows are therefore smoothed, calibrated, almost engineered. In short, XYLD pays out what the market offers, while JEPI and JEPQ pay out what their managers design. And that is the whole difference between income you endure and income you build.
That’s for the monthly perspective. What about the yearly perspective?
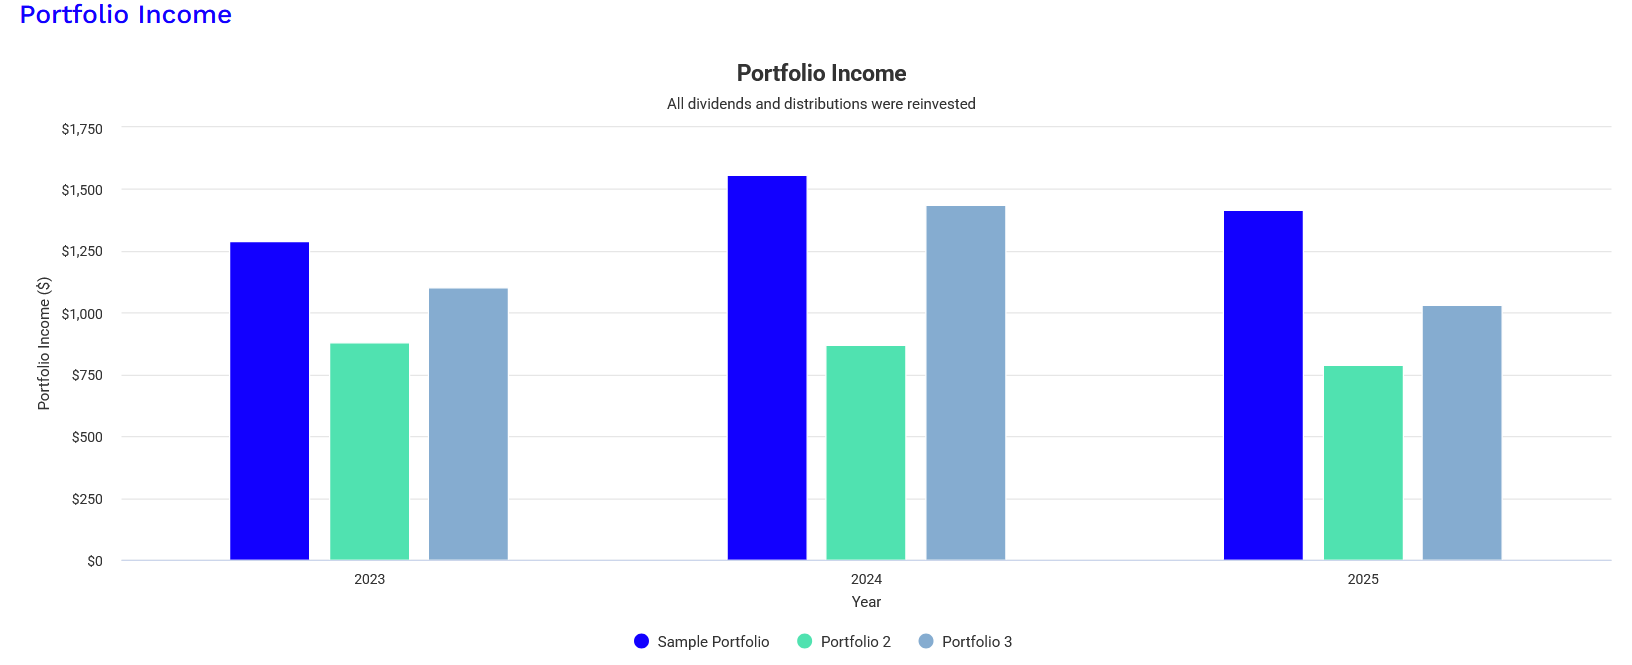
Source: Portfolio Visualizer
This chart of annual income provides crucial insight into the reliability and behavior of the income, going beyond mere monthly volatility.
XYLD (Portfolio 3): The High, but Market-Dependent Income. XYLD’s annual income is stable over this period but entirely dictated by market volatility. It offers no growth and is fully exposed to the cycles of investor fear and complacency. This is “raw” market income.
JEPI (Portfolio 2): The Smoothed and Resilient Income. JEPI’s profile is the most defensible. Its core strength is not appreciation, but consistency and resilience. The active management of its equity portfolio and its use of OTM calls smooths out the cash flow, protecting it from the sharp downturns that affect XYLD. It provides a reliable, high-quality income stream that holds up well across different market environments.
JEPQ (Portfolio 1): The High-Potential, Cyclical Income. JEPQ’s income is the most volatile, mirroring the boom-and-bust cycles of its tech underlying. It can deliver spectacular payouts in strong years but is also the most susceptible to sharp declines, as the projection for 2025 suggests.
Annual Conclusion: The choice crystallizes between a high but unpredictable income (XYLD), a stable and resilient income (JEPI), and a high-potential but cyclical income (JEPQ). For an investor seeking predictable and defensive income, JEPI is the clear standout.
The Case for the Three-Fund Mix
This refined understanding makes a powerful case for combining all three. You are not blending three identical income streams, but three complementary engines that cover the entire spectrum of market environments:
XYLD acts as the strategic anchor, providing a high base level of yield.
JEPI acts as the tactical stabilizer, delivering consistent and reliable income that smooths out XYLD’s volatility.
JEPQ acts as the performance booster, capturing periods of high tech volatility and growth to provide outsized returns.
Therefore, the mix is not just attractive—it is strategic. It creates a robust, all-weather income portfolio designed for both stable cash flow and participation in growth, effectively turning the weakness of any single fund into the diversified strength of the whole.
II/ The Total return and NAV erosion debate
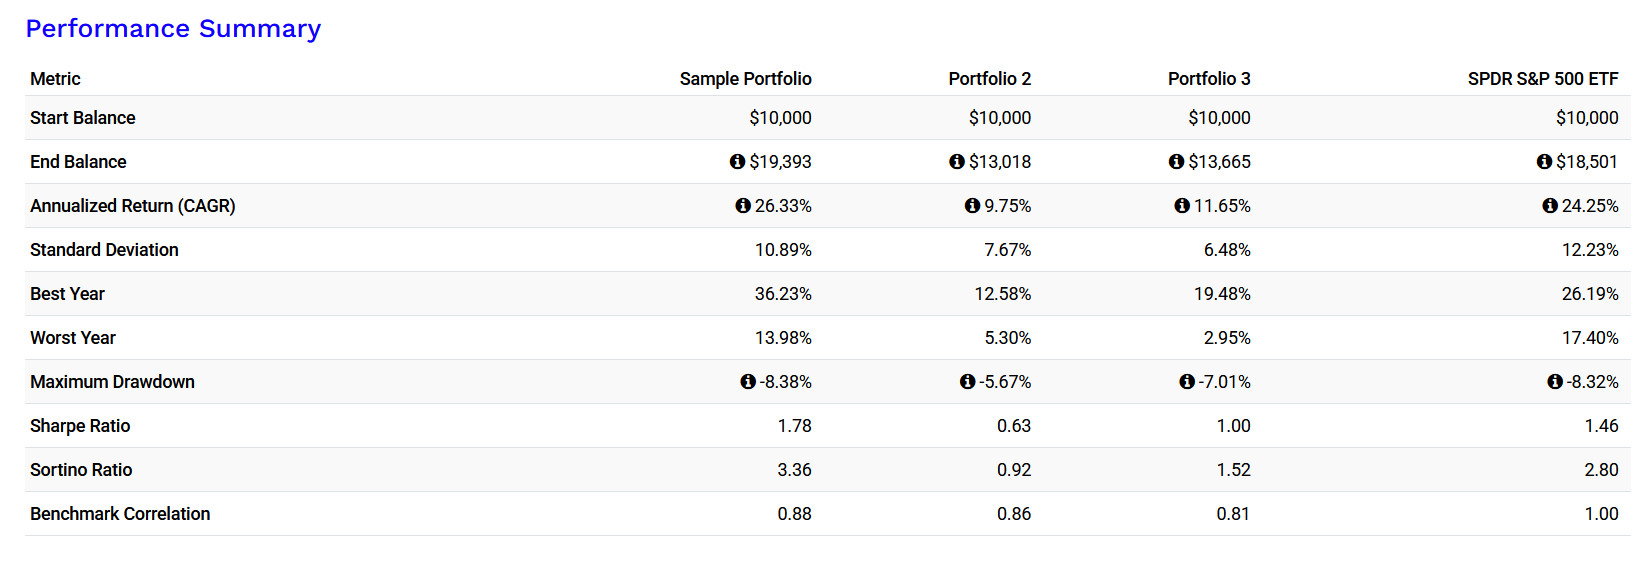
Source: Portfolio Visualizer
A/ Total Return Analysis: One Clear Winner, Two Also-Rans
This performance summary delivers a stark verdict for the total return investor. The primary goal here is wealth accumulation, and only one strategy truly delivers.
1. The Dominant Outperformer: Sample Portfolio (JEPQ)
From a total return standpoint, JEPQ is in a league of its own. It isn’t just the best among covered call ETFs; it beat the S&P 500 itself.
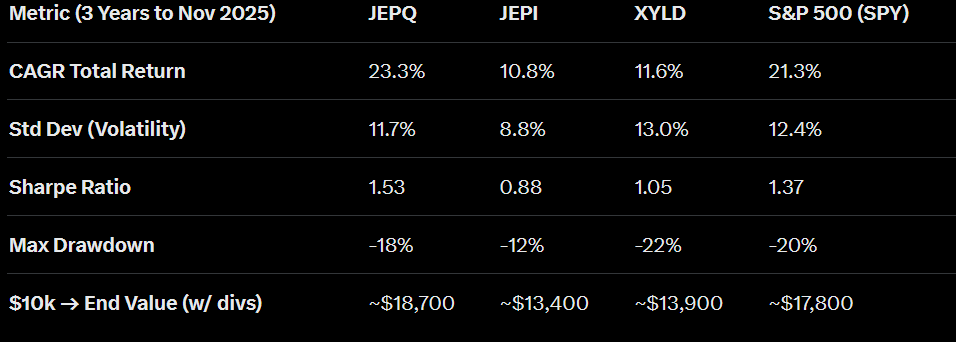
Superior Growth: A 26.33% CAGR surpasses the S&P 500’s 24.25%. This demonstrates that the powerful growth of the Nasdaq-100 can more than compensate for the upside cap imposed by the call strategy.
Efficient Growth: Crucially, it achieved this higher return with lower risk (10.89% Std Dev vs. 12.23%) and a similar maximum drawdown. Its exceptional Sharpe Ratio (1.78) confirms this was the most efficient risk-adjusted return in the entire comparison. The call premium provided a direct boost to returns and a buffer against volatility.
2. The Capital-Drag Strategies: JEPI & XYLD
Both JEPI and XYLD severely handicap an investor’s wealth-building potential. Their “safety” comes with an extreme opportunity cost.
Chronic Underperformance: With CAGRs of 9.75% and 11.65% respectively, they delivered less than half the annualized return of JEPQ over this period. An initial $10,000 in JEPI grew to ~$13,000, while in JEPQ it grew to over $19,000.
Inefficient Safety: While they were less volatile, their risk-adjusted returns (Sharpe Ratios of 0.63 and 1.00) are significantly inferior to both JEPQ and the S&P 500. This means investors were not adequately compensated for the massive growth they sacrificed. The “safety” was inefficient and costly.
B/ The Verdict for the Total Return Investor
The choice is unambiguous:
For Maximum Total Return: JEPQ is the only logical choice. It successfully leveraged a high-growth asset and used the covered call strategy to enhance risk-adjusted results, ultimately leading to superior wealth accumulation.
JEPI and XYLD are not total return vehicles. They are income vehicles that, in this strong market cycle, acted as a significant drag on portfolio growth. An investor focused purely on growing their capital would have been deeply disappointed with their results.
In conclusion, if the goal is to maximize the end balance, the data clearly shows that JEPQ’s strategy of writing calls on a high-growth index was the most effective path to superior total return.
C/ NAV Analysis: Stagnation in Name, Erosion in Real Terms
This portfolio growth chart reveals the critical distinction between nominal and real performance for covered call strategies.
JEPI & XYLD: The Stagnation That Erodes Purchasing Power
The flat trajectories of Portfolio 2 (JEPI) and Portfolio 3 (XYLD) show nominal capital stagnation. While the principal value was preserved in dollar terms, it failed to grow. In an inflationary environment, this stagnation translates directly into a loss of purchasing power. The high income they distribute, therefore, is not purely a bonus; it partially serves as a necessary offset to this hidden erosion of the capital’s real value. In essence, these strategies create an income stream that is funded by sacrificing both growth and the inflation-adjustment of the principal.
JEPQ: Growth That Overcomes the Real-Term Test
In stark contrast, the Sample Portfolio (JEPQ) demonstrates the power of combining high growth with income. Its explosive performance not only increased the nominal NAV but did so at a rate that significantly outpaces inflation. This resulted in genuine growth of the capital’s real purchasing power. Here, the covered call income is a true enhancement to an already appreciating asset base.
The Bottom Line: The key takeaway is that for income ETFs, nominal NAV stability can be deceptive. True capital preservation requires growth that at least matches inflation. From this perspective, JEPI and XYLD expose investors to real-term NAV erosion, while JEPQ provided a buffer against it through substantial real returns.
III/ The European Income Attempt: JEPQ, XYLD and JEPI
For international readers, especially in Europe, US-listed ETFs are often inaccessible due to regulations. The landscape is dominated by UCITS (Undertakings for Collective Investment in Transferable Securities) compliant funds, which offer a different perspective on the covered call strategy.
A/ A Three-Way UCITS Comparison
While a perfect, like-for-like replica of the JP Morgan funds is rare, the European market offers clear strategic counterparts that validate our findings on a global stage.
The JEPI Equivalent: JEPG (JPMorgan Global Equity Premium Income UCITS ETF)
JEPG is the direct, UCITS-compliant sibling of JEPI. It employs the same active, low-volatility equity selection and uses ELNs to write OTM calls. The objective is identical: to provide a smoothed and resilient income stream with some participation in upside growth. It is the European tool for building a reliable, high-quality income.The JEPQ Equivalent: Tech-Focused UCITS Covered Call ETFs (JEPQ in London et JEQP in Germany :
While a direct clone of JEPQ is less common, several UCITS ETFs apply a systematic covered call strategy on the tech-heavy Nasdaq-100 (e.g., those offered by providers like WisdomTree or Lyxor). These funds mirror JEPQ’s exposure to the sector’s high-growth, high-volatility profile. They offer the potential for explosive income during tech rallies but come with the same cyclicality and susceptibility to sharp downturns.The XYLD Equivalent: Systematic European & Global Covered Call ETFs
The most common UCITS covered call ETFs replicate the XYLD model. They track a European or global index (like the EURO STOXX 50 or MSCI World) and write ATM calls on 100% of the portfolio. They are the quintessential high-income, capital-stagnation engines, providing “raw” market yield at the total cost of long-term capital appreciation.
B/ Income results
While the UCITS versions of these strategies are relatively new to the market—launched between mid-2023 and late 2024—their early track record already echoes the patterns observed in their U.S. counterparts. With limited historical data (typically 1-2 years), our analysis relies on available monthly distributions and yields, focusing on consistency rather than long-term cycles.
As with the U.S. funds, these European ETFs distribute monthly, blending option premiums with underlying dividends to generate income. However, UCITS regulations impose stricter liquidity and transparency rules, which can slightly temper yields compared to U.S. versions but enhance accessibility for EU investors. From a monthly perspective, dividend volatility remains low across the board, reflecting the smoothing effects of active (or semi-active) management in JEPG and JEPQ UCITS, versus the more market-tied fluctuations in XYLU. Based on available data:
JEPG (JEPI Equivalent): σ ≈ £0.034 (over 23 months), showcasing the lowest volatility. Its global low-volatility equity selection and OTM call overlays via ELNs create a calibrated payout stream, rarely dipping below £0.08 or exceeding £0.15 (barring one outlier in June 2025 tied to heightened volatility).
JEPQ UCITS (JEPQ Equivalent): Limited to ~13 months of data, with σ estimated at ~£0.025 (preliminary, based on yields and partial history). As a Nasdaq-focused fund, its payouts show mild cyclicality, averaging ~£0.20 monthly but with slight upticks during tech rallies.
XYLU (XYLD Equivalent): σ ≈ £0.016 (over 27 months), surprisingly tight for a systematic ATM strategy on the S&P 500. This reflects the stabilizing influence of synthetic swaps, though payouts are more sensitive to U.S. market VIX swings, ranging from £0.07 in low-vol periods to £0.13 in elevated ones.
These figures align with U.S. trends: JEPG and JEPQ UCITS engineer smoother flows through partial coverage and manager discretion, while XYLU delivers “raw” premiums that track market conditions more closely. The key insight? Even in Europe, active hybrids like JEPG prioritize reliability over raw yield. Shifting to the yearly perspective, the chart of annual income (aggregated from monthly distributions) highlights reliability amid short histories and varying market environments (e.g., the 2024 tech rebound and 2025’s mixed cycle).
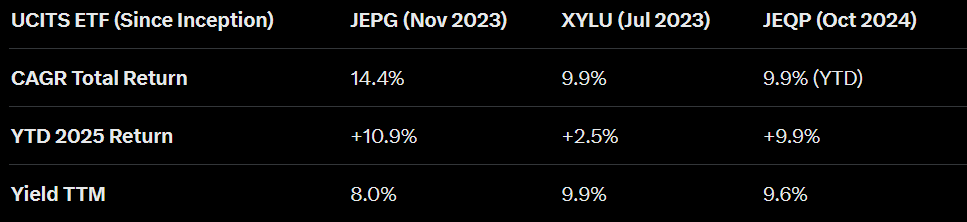
XYLU (Portfolio 3 Equivalent): The Market-Driven Anchor. Annual income totaled £1.07 in 2024 and ~£1.05 YTD 2025 (projected ~£1.26 full-year). Like its U.S. sibling, it’s stable but fully exposed to volatility cycles—higher in uncertain years, muted in calm bulls. This provides a high base (10-11% yield) without frills.
JEPG (Portfolio 2 Equivalent): The Engineered Stalwart. Delivering ~£1.33 in 2024 and ~£1.49 YTD 2025 (projected ~£1.63), it demonstrates resilience with modest growth in payouts. Its defensive global tilt and OTM strategy buffered 2025’s early wobbles, offering the most consistent profile for European income seekers.
JEPQ UCITS (Portfolio 1 Equivalent): The Volatility Harvester. Early data shows ~£1.85 annualized in 2024 (partial) and ~£2.10 projected for 2025, with a 9-10% yield. It shines in tech-favorable periods but hints at cyclical dips, mirroring Nasdaq’s boom-bust nature.
Annual Takeaway
With shorter histories, patterns are emerging but not battle-tested. XYLU offers predictable high yield tied to markets; JEPG excels in smoothed resilience; JEPQ UCITS promises upside in growth phases. For Europeans, JEPG stands out for its balance, while the trio’s mix diversifies across global, tech, and broad-market exposures—creating an all-weather income engine compliant with UCITS standards.C/ NAV erosion?Given the youth of these UCITS funds (1-2 years of data), a full “erosion” analysis is preliminary, but early performance underscores the same trade-offs as their U.S. peers: income at the expense of growth potential.
Total returns (including reinvested distributions) reveal modest appreciation overall, but nominal NAV trajectories often stagnate in rising markets due to capped upside from calls. In real terms—factoring ~2-3% EU inflation—this can imply subtle erosion unless yields fully offset it.
Balanced but capped over their brief lifespans, these ETFs prioritize income over aggressive growth, lagging pure equity benchmarks like MSCI World (~15% CAGR over 2 years) but offering downside cushions.
The Resilient Performer: JEPG (JEPI Equivalent)
Solid Foundation: ~6% CAGR since inception (Nov 2023), with YTD 2025 at -1.8% but 1-year total return +12.3%. Volatility (10.7%) and max drawdown (-11.3%) are the lowest, yielding a Sharpe ratio ~0.6—efficient for defense.
Why It Works: Active low-vol stock picks and OTM calls allow ~70% upside capture, turning premiums into a true buffer without severe drag.
The Steady but Subdued: XYLU (XYLD Equivalent)
Income-Focused Grind: ~8% CAGR since Jul 2023, but YTD -5.9% and 1-year +0.5% highlight stagnation in bull legs. Higher yield (11%) compensates, but vol (14.4%) and drawdown (-20.5%) make it less efficient (Sharpe ~0.03).
Trade-Off Exposed: Full ATM coverage caps recovery, leading to flat NAV in rallies—ideal for yield chasers, not growth hunters.
The High-Potential one: JEPQ UCITS (JEPQ Equivalent)
Growth with Guardrails: ~9% total return since Oct 2024 (1-year +7.5%), but higher vol (20.1%) and drawdown (-24.1%) reflect Nasdaq exposure. Sharpe ~0.4 suggests room for outperformance in tech upswings.
Nasdaq Edge: Partial OTM calls preserve more upside than XYLU, but early data shows vulnerability in corrections—premiums help, yet it’s the most “cyclical” here.
NAV Reality: Preservation with a Catch
The portfolio growth trajectories (NAV + reinvested income) paint a familiar picture: XYLU and JEPG show near-flat nominal NAV lines, buoyed by distributions that preserve principal in dollars/euros but struggle against inflation. For instance, an initial €10,000 in XYLU grew to ~€11,900 total (mostly income), while pure S&P exposure might hit €12,500. JEPQ UCITS edges toward genuine appreciation, with NAV up ~5% net of payouts, outpacing inflation for real growth.Bottom Line: UCITS covered calls mirror U.S. dynamics—nominal stability masks real erosion for income-heavy strategies like XYLU and JEPG, where yields (~8-11%) serve as inflation hedges.
JEPQ UCITS offers the best shot at real capital gains, but all three underscore the strategy’s core paradox: robust cash flow funded by forgone appreciation. In Europe’s regulated landscape, this makes them complementary tools, not standalone growth engines.
Investment Takeaway
This combo can be a viable strategy for US and ex-US income investors. With UCITS rules, yield would be a little bit lower (lower risk, lower yield). At least for those who accept risk, income volatility and NAV nominal stagnation. I own these three but I have to admit that JEPQ represents 90 % of my covered call investments. I like JEPG because it is global, but the yield is too low.
For European investors eyeing covered calls, the UCITS trio (JEPG, JEPQ UCITS, XYLU) validates the U.S. playbook: blend for diversification—JEPG for stability, JEPQ UCITS for tech-fueled potential, XYLU for baseline yield. With short histories, monitor volatility spikes, but their monthly payouts already deliver counter-cyclical comfort. Prioritize based on risk: defensive (JEPG), aggressive (JEPQ UCITS), or pure income (XYLU). In a portfolio, you can allocate to this mix for resilient, all-weather income without U.S. tax headaches—turning market anxiety into engineered cash flow.
We have already written about these 3 ETFs, I focus on JEPQ because I can have the cake and eat it too: growth and income. But in the long run, a mix of these three would be more reasonable.
Because 10% yield portfolios can be reasonable too: this is what we’re working on each week.
Liked this Deep-Dive? Buy Me a Coffee!
Your support keeps this newsletter independent and research-driven. If this analysis saved you time or gave you a new investment idea, consider making a one-time donation. Every contribution helps me maintain part of the research free and accessible to everyone.