

The first time I invested in CLOs, I was fully aware that I was collecting a very high yield in exchange for deliberately ignoring how the product actually worked. That mindset was obviously not sustainable in the long term, but it allowed me to become familiar with the asset class more than ten years ago. Over time, I observed the often erratic movements in their net asset value, along with the discounts and premiums — and with hindsight, I even managed to profit from them. Today, I want to fully rationalize my investment in CLOs. While many investors still despise these instruments, I believe they have genuine utility and can be highly suitable in specific situations. As an income investor, I am convinced they deserve a place in my portfolio.
I/ Theory: a High Risk / High Yield Asset
A/ What Are CLOs Actually Made Of?
CLOs are essentially big baskets filled with loans granted to highly leveraged companies — often over-indebted firms and SMEs that traditional banks tend to avoid. Taken individually, these leveraged loans are risky and unattractive to most conservative investors.
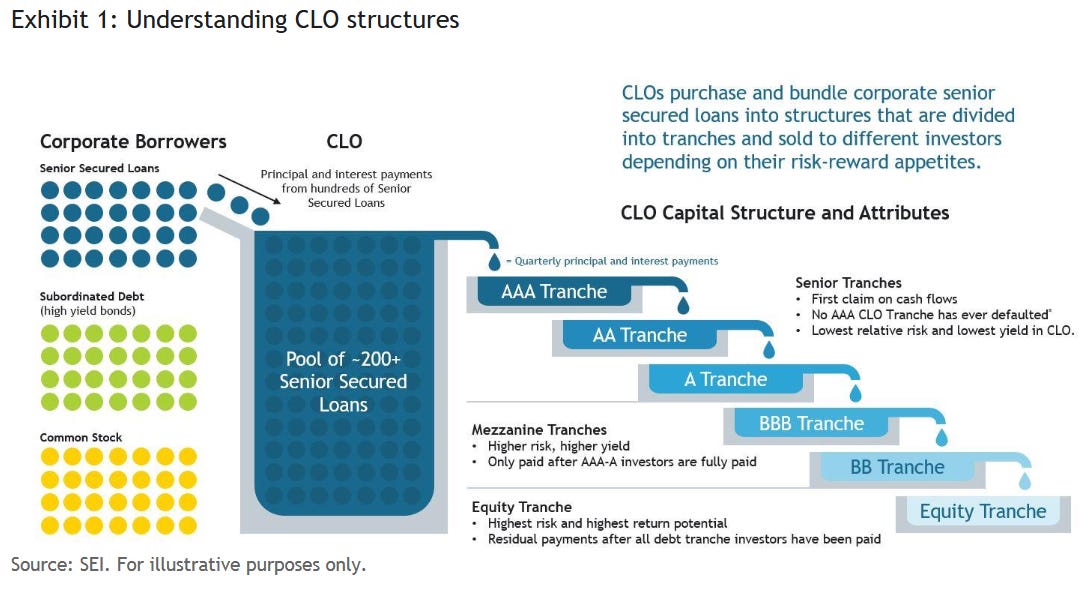
Source: https://www.seic.com/sites/default/files/2024-02/SEI-What-is-a-CLO.pdf
B/ How CLOs Work: The Tranche Structure
This is where the Collateralized Loan Obligation (CLO) comes in. Hundreds of these loans are pooled together into a single vehicle, and the cash flows are then redistributed according to a strict hierarchy known as the tranche structure.
At the top sit the senior (AAA) tranches. They benefit from first priority in payments and last-loss position. Their yields are lower, but their protection is the highest.Below them are the mezzanine tranches (AA down to BBB). They offer a balanced trade-off: more risk than senior tranches, but still significant protection, in exchange for higher yields.
At the very bottom lies the equity tranche. It absorbs the first losses but captures the excess returns. When defaults remain low, equity tranches can deliver very attractive — sometimes spectacular — yields.
C/ Economic Role of CLOs
The entire logic of a CLO rests on risk redistribution: conservative investors take the senior tranches, while those seeking higher returns move down the capital structure. At first glance, this system can feel unsettling. It transforms risky corporate loans into sophisticated structured products.
Some CLOs are indeed poorly managed and stuffed with weak credits. However, dismissing all CLOs as speculative vehicles would be a mistake. They play a genuine economic role by channeling capital to companies that might otherwise struggle to find financing.
While comparisons to the subprime CDOs of 2008 are common, the analogy is imperfect. CLOs are backed by corporate leveraged loans, which have historically performed much better than the toxic mortgages of 2008. Since the financial crisis, senior CLO tranches have shown remarkable resilience.
II/ Facts: High Yield / High Risk Again
A / The Equity Tranche: A Long-Term Bet on Volatility
The CLO equity tranche sits at the very bottom of the capital structure. In return for absorbing the first losses, it captures the residual cash flows and experiences the full emotional spectrum of financial markets. Over the very long run, the numbers are compelling. But the path to those returns is paved with moments of genuine panic.
The most useful tool for measuring this segment is the Flat Rock CLO Equity Returns Index, which began on September 30, 2014. It tracks the unlevered, gross-of-fee performance of US CLO equity tranches through the market-weighted holdings of publicly reporting funds. The index measures total return, including reinvested distributions — not just price appreciation.
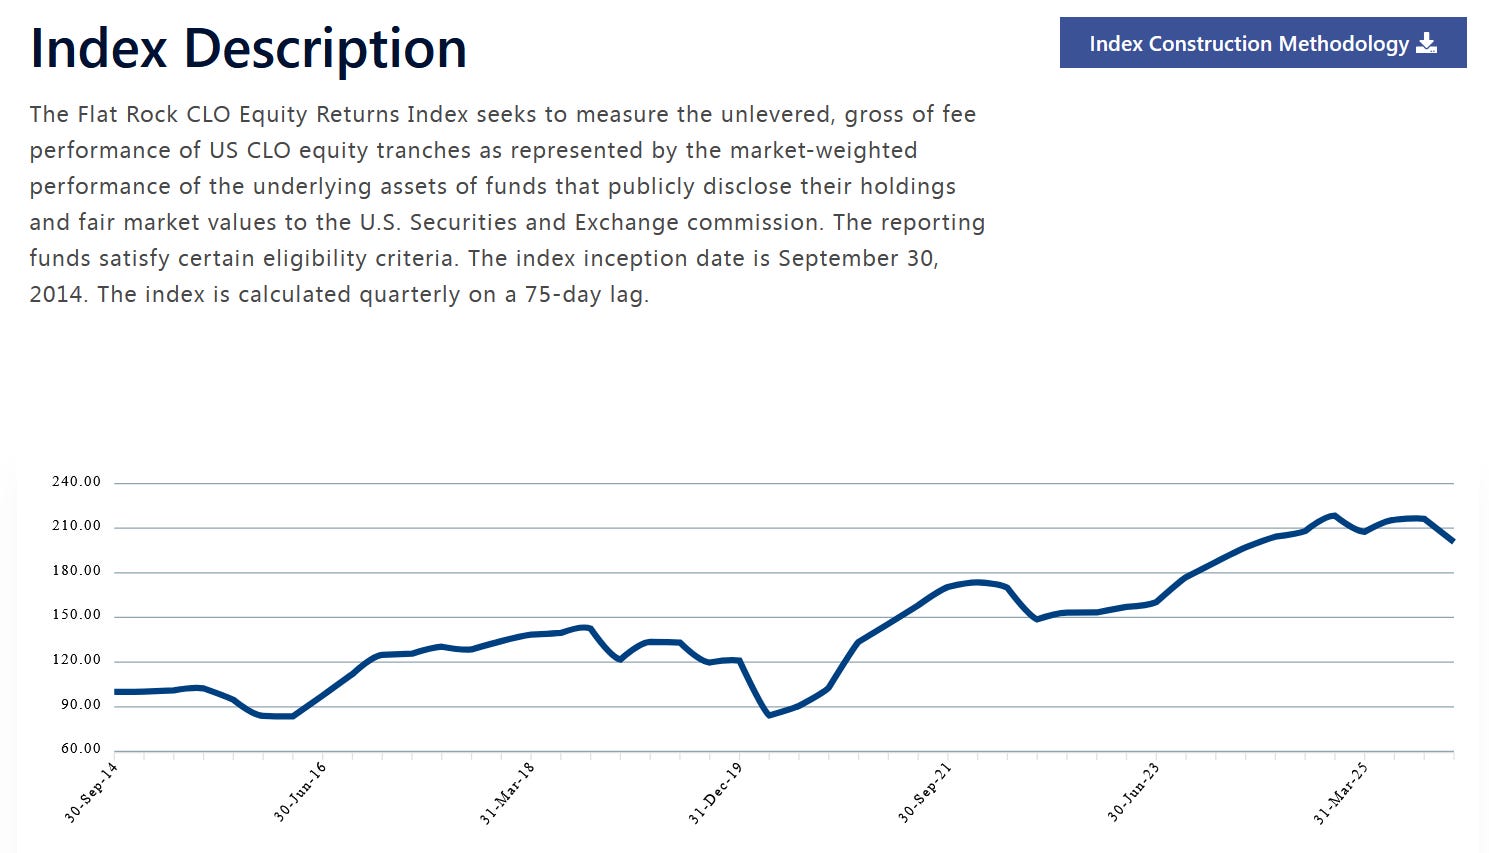
Source: https://flatrockglobal.com/clo-equity-index/
Since inception, the index has generated an annualized return of 6.4%. Yet, the journey between the starting point and that average tells a far more turbulent story. Consider the recent history of CLO equity. In 2016: the index soared 48.81%, a year of almost irrational exuberance. In 2021, it climbed another 29.91%, as if the pandemic had never happened. Then look at the other side. In 2015, still finding its footing, the index lost 16.26%. In the first quarter of 2020, as Covid-19 froze global markets, it collapsed by 30.41%: the single deepest quarterly drawdown in its history. And in 2025, long after the panic had subsided, it quietly declined another 8.1%.
These are structural features of the equity tranche and the direct, mechanical consequence of sitting at the bottom of the capital structure. When the underlying loans perform well and defaults stay low, equity captures the excess and delivers spectacular returns. When the cycle turns, the same tranche absorbs the first losses, and the drawdowns arrive with brutal regularity. To hold CLO equity is to accept this rhythm: euphoria, then panic, then recovery, then quiet erosion. The long-term annualized return of 6.4% is real. But the path to that average runs directly through -30%. You want high yield ? So be prepared for mega drawdowns.
The index’s maximum quarterly drawdown stands at -30.4%, and its standard deviation of returns is 18.7%. To put that in perspective: an asset with 18.7% annual volatility will, in a normal distribution, experience a decline of 10% or more roughly once every three years. More recently, the index has faced a challenging period. For the year ending December 31, 2025, the index returned -8.1%, a reminder that even after the post-Covid recovery, the asset remains sensitive to credit spreads, refinancing conditions, and the underlying health of leveraged loan markets.
For the income-focused investor, the equity tranche presents a paradox: its long-term annualized return is respectable, but its short-term volatility can be disorienting. The equity holder is, in effect, selling insurance against a wave of corporate defaults. Most years, that premium is collected peacefully. In certain years — 2020, 2015, and to some extent 2025 — the insurance is called upon, and the investor must have both the capital resilience and the psychological fortitude to wait for the eventual recovery. For those unwilling to accept this trade-off, the senior and mezzanine tranches offer a calmer alternative.
B/ The Debt Tranches: A More Peaceful Journey
If the equity tranche is a tale of emotional extremes, the debt tranches tell a far quieter story: one of steady accumulation and structural resilience. Since January 2012, Palmer Square Capital Management has tracked two flagship US CLO debt indices. The CLODI follows mezzanine tranches (A, BBB, BB), while the CLOSE focuses on senior tranches (AAA, AA). Their track records are remarkably consistent.
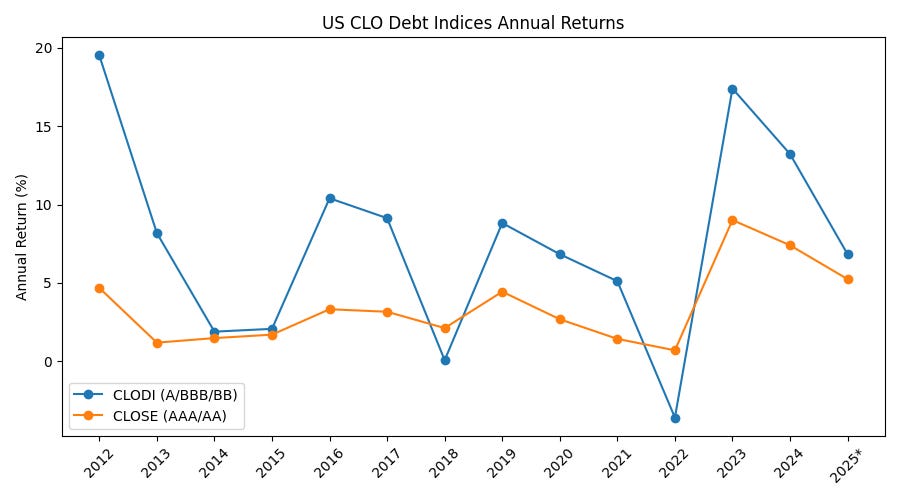
Over this 14-year period, the CLODI posted just one negative year (-3.59% in 2022). The senior CLOSE index has never recorded a negative calendar year. Since inception, they have annualized at 7.43% and 3.46% respectively — a four-percentage-point premium for stepping one or two notches down the capital structure.
European CLO debt tells a more cautious story. Since 2018, the ECLODI (mezzanine) and ECLOSE (senior) indices have delivered lower returns, with greater volatility during stress periods. European mezzanine debt has annualized at 4.65%, notably lower than its US equivalent, with sharper drawdowns in difficult years.
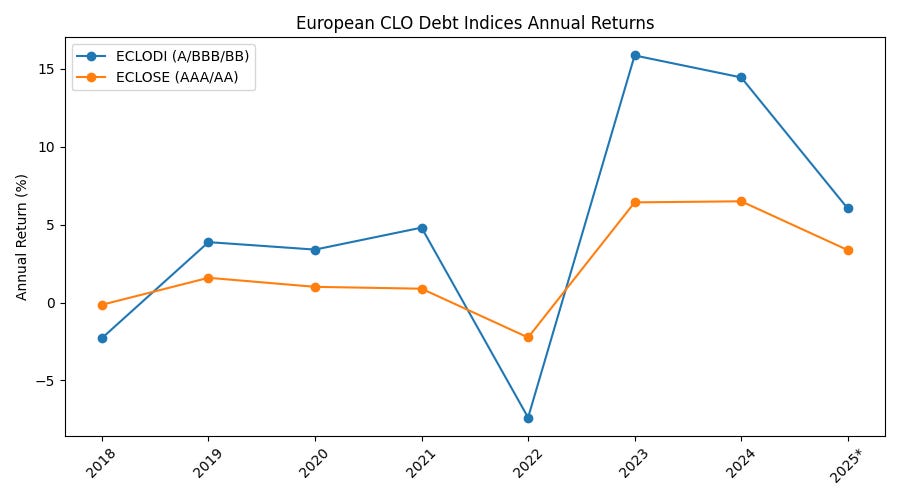
In short, the debt tranches offer a proposition that is almost refreshingly boring: high single-digit returns in the US with very few losing years, and rock-solid capital preservation for senior tranches. For the income investor who finds the violent swings of CLO equity difficult to stomach, the debt tranches provide a compelling middle path: a lower ceiling, but a much higher floor.
III/ A Case Study: a Mix of Equity, debt, US and Euro Tranches
After exploring the theory and historical data, one question remains: how can an individual investor actually access this asset class in practice? Direct investment in CLO tranches is out of reach for most people. Minimum ticket sizes are high, liquidity is limited, and proper due diligence demands significant expertise. This is where listed vehicles like Volta Finance come into play.
A / A Deliberate Mix, Not a Pure Bet
Volta Finance is neither a pure CLO equity play nor a conservative debt fund. It deliberately blends exposure across the capital structure and geographies. As of 31 March 2026, the portfolio was allocated approximately 39% to CLO equity (15.5% USD / 23.2% EUR) and 48% to CLO debt (16.6% USD / 31.0% EUR), with the remainder in cash (9.8%) and a small tail of CLO warehouse investments and other assets.
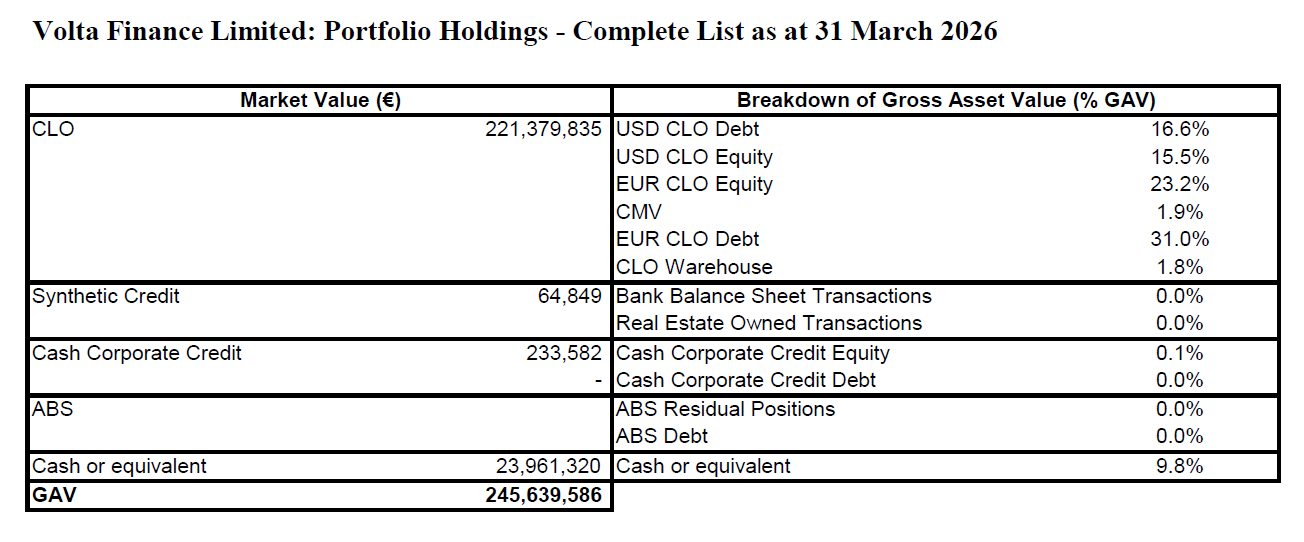
Source: https://www.voltafinance.com/investor-relations/fund-structure/portfolio-composition/
This balanced approach sets it apart from more concentrated peers such as Oxford Lane Capital, which is heavily tilted toward equity. Volta seeks to capture part of the upside of equity while using debt tranches as a stabilizing force. Geography also plays a key role. By investing in both US and European CLOs, the fund trades some potential return for greater diversification and resilience.
B / Long-Term Performance
The fund’s share price tells only part of the story. In Volta’s case, that story is one of survival, recovery, and quiet accumulation. Since its launch in 2010, Volta Finance has weathered two major credit shocks: the tail end of the 2008‑2009 financial crisis and the Covid‑19 panic of 2020. After bottoming near zero in the aftermath of the crisis, the share price rebuilt steadily and has traded mainly between €4 and €8 since 2012. Volatility remains a defining feature — sharp drawdowns occur when credit spreads blow out, but recoveries have followed each time.
Since 2020, the price has consolidated in a tighter range, mostly between €4.5 and €7.5, reflecting improved CLO market conditions and the fund’s proven resilience. Over the past three years, Volta has traded in the upper part of its historical range. At first glance, the long‑term price chart (excluding dividends) appears relatively flat. But that would be a misleading impression. The share price is not the shareholder return.
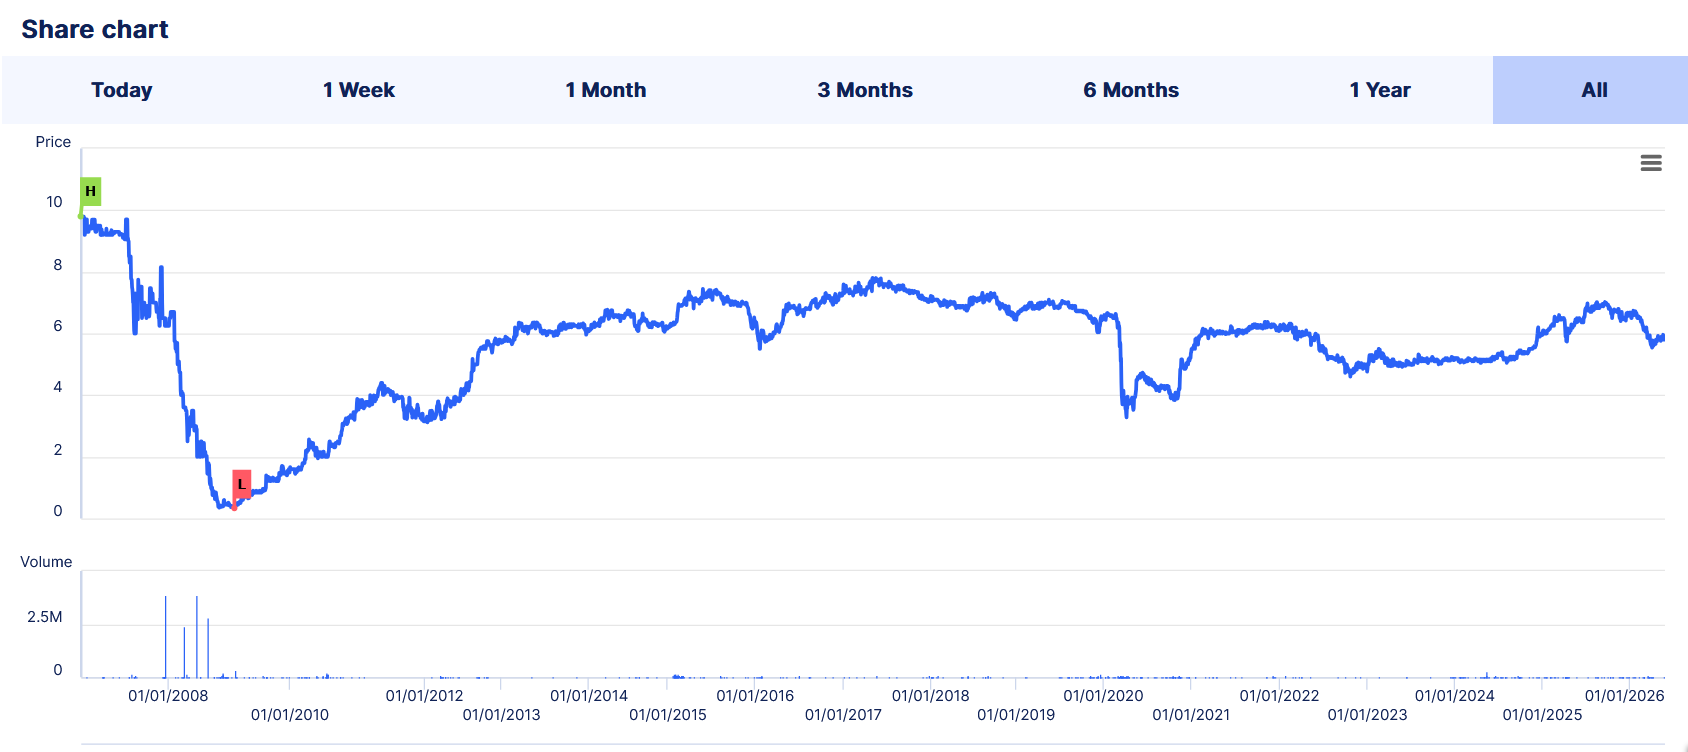
Source: https://www.voltafinance.com/investor-relations/reporting/share-price-information/
Volta’s dividend stream has shown reassuring regularity. The fund has maintained a steady distribution policy, paying out a percentage of NAV rather than a fixed amount. In calmer years, that has translated into generous cash flows. In downturns, distributions soften, because the underlying CLO cash flows themselves come under pressure when credit markets tighten. The dividend history therefore tells a double story: the persistence of income in ordinary times, and the vulnerability of that income when the economic weather turns foul. High, but cyclical, yield.
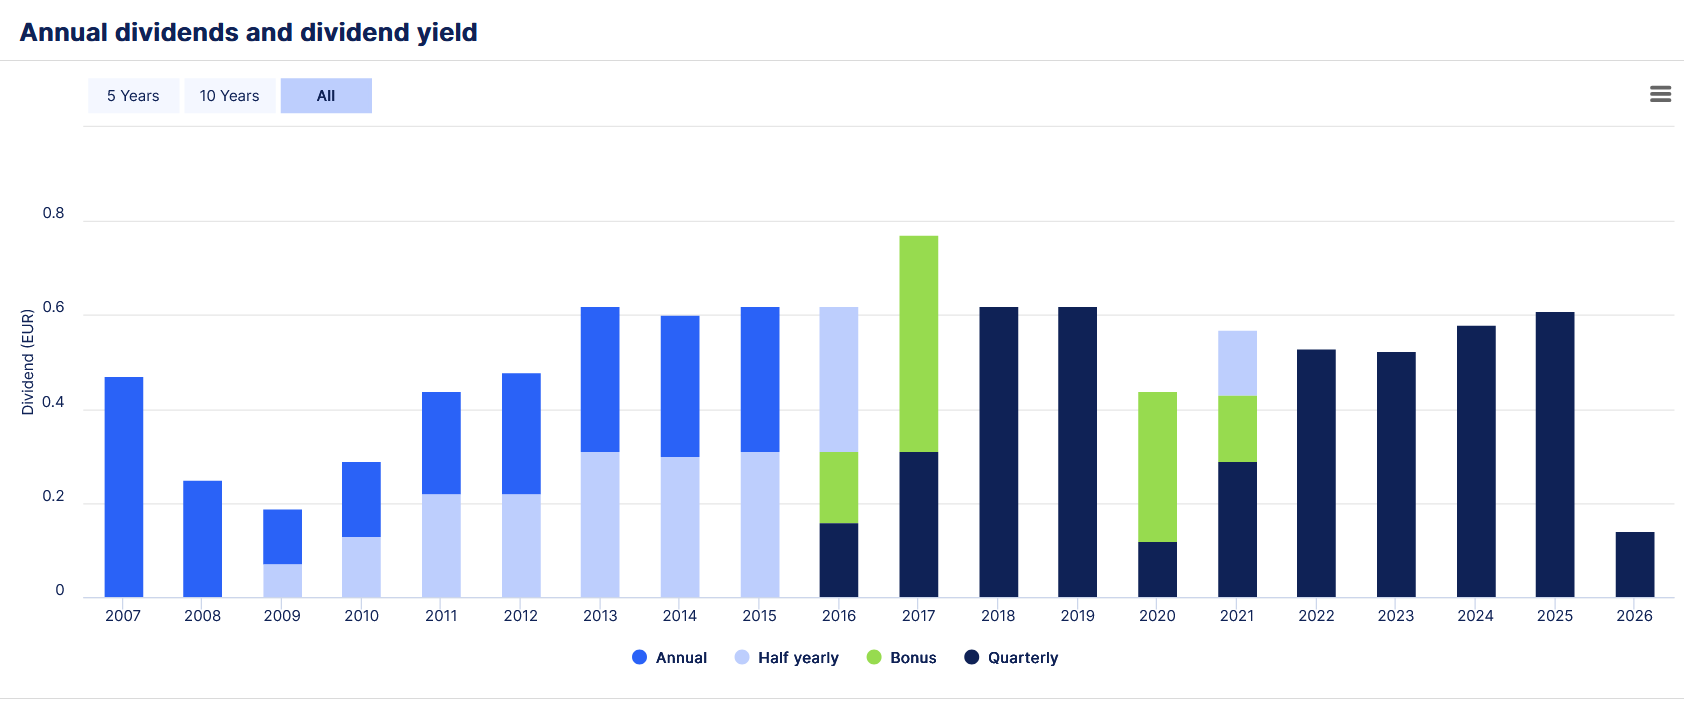
Source: https://www.voltafinance.com/investor-relations/reporting/dividends-information/
Thanks to consistent distributions, the total shareholder return (price appreciation plus reinvested dividends) is significantly higher than the share price chart suggests. According to Volta Finance’s official literature, the fund has delivered an annualised total return of approximately 8.7% since inception — a respectable figure for an income‑oriented vehicle that has navigated two major crises. This performance is not spectacular, but it is solid. And for the income investor, it comes with an additional, often overlooked lever: the discount.
C / The Power of the “Double Discount”
Analysts, notably Mark Thomas at Hardman & Co, often describe Volta as trading at a double discount (https://hardmanandco.com/research/corporate-research/volta-discount-into-perspective/). The first discount is obvious: the share price frequently trades below the reported NAV.
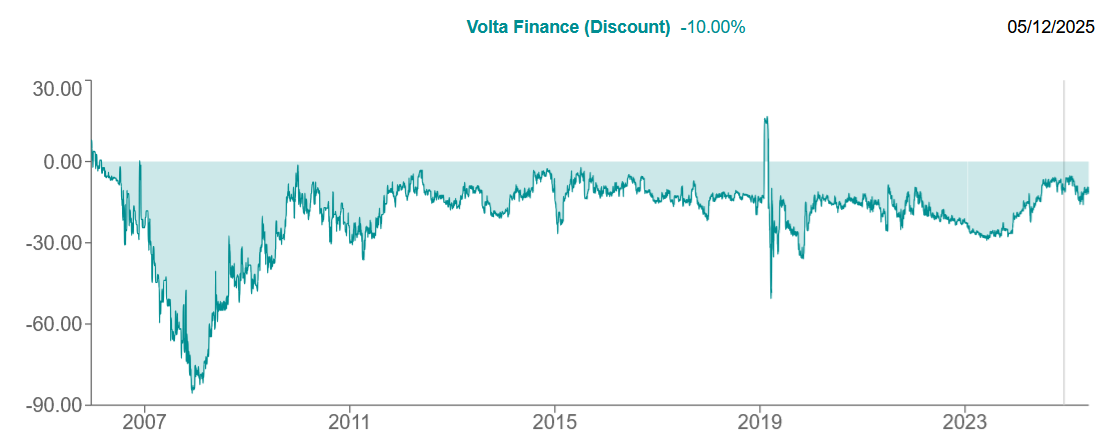
Source: https://www.theaic.co.uk/companydata/volta-finance/performance
The second, more subtle discount lies in the underlying assets themselves — particularly the CLO equity positions, which are often valued with illiquidity and sentiment discounts already embedded.
This double discount works both ways. When sentiment improves, it can significantly amplify returns. When credit conditions deteriorate, it can magnify losses. For patient investors, buying at wide discounts can substantially enhance long-term potential. That’s the sweet spot.
Investment Takeaway
Volta remains exposed to credit cycles, spread movements, and closed-end fund discount volatility. Drawdowns are inevitable. Yet for many income investors, it offers a pragmatic and accessible way to gain exposure to the CLO universe. Volatility is high, and success requires buying at attractive levels and holding for the long term. It is time to conclude. In my Pipart Global Income portfolio, CLOs have a clear role to play. They deliver high income in exchange for elevated volatility.
However, I must approach them tactically and through the right vehicle. To be pragmatic: achieving double-digit yields and strong long-term returns requires investing during periods of wide discounts to NAV. Currently, the discount is average (around 12%) and the yield stands at approximately 10.5%. I will therefore buy some shares at the current price of €5.88 to lock in a double-digit yield. However, the real purpose of this position is to keep me closely attuned to the price action, so I can seize the next opportunity when the discount widens significantly, allowing me to add to the position at better levels and hold it for the very long term. This is the core challenge for income investors in CLOs: to collect attractive income tied to credit risk, purchased at a meaningful discount, with a multi-year holding horizon.
Liked this Deep-Dive? Buy Me a Coffee!
Your support keeps this newsletter independent and research-driven. If this analysis saved you time or gave you a new investment idea, consider making a one-time donation. Every contribution helps me maintain part of the research free and accessible to everyone.