
Banco do Brasil Part 1 – A 10%+ Yield Proxy for Brazil’s Long-Term Growth?
Part 1 - Macro strengths

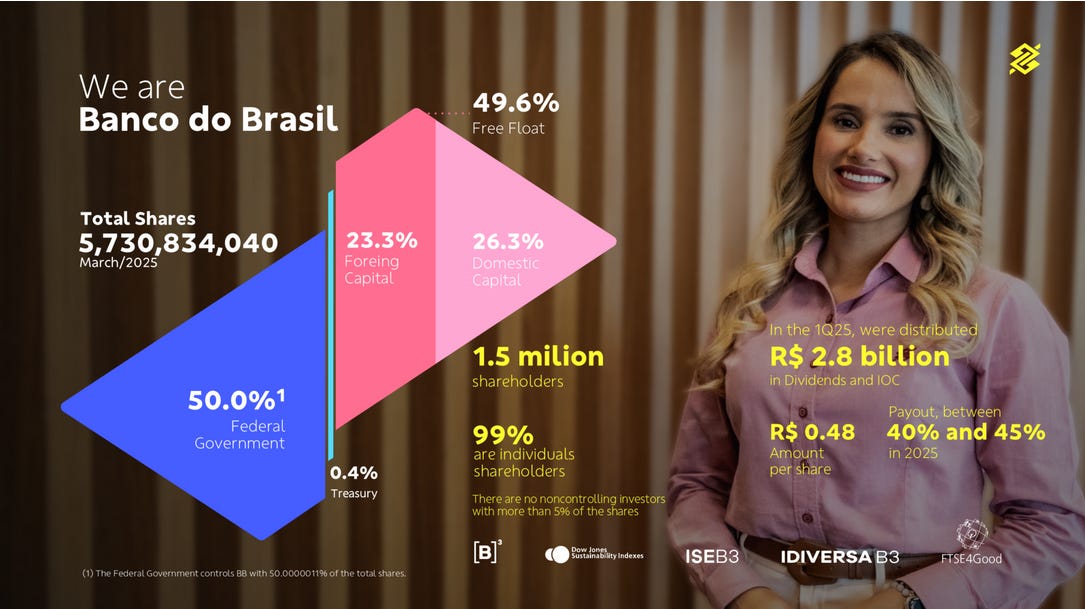
Banco do Brasil (BBAS3, BDORY as an ADR), established in 1808, stands as a major financial institution in Brazil, with 50% state ownership. Boasting a market capitalization of approximately 40 billion USD and a network of over 4,700 branches, this public bank holds a pivotal role in the Brazilian economy, serving as a key barometer of national health and commodity trends, particularly through its deep ties to the agricultural sector and export markets. Why consider a long-term investment in this entity? Let’s explore its strengths and the macro factors that might appeal to patient investors, with a special focus on its dividend potential as a cornerstone of long-term value. We’ll discuss specific risks in Part 2 next week.
I/ Banco do Brasil: A Proxy for Brazil’s Economic Health Since 1808
A/ Two Centuries of Resilience
When King John VI fled Napoleon’s invasion in 1808 and set sail for Rio de Janeiro, he didn’t just save his crown—he founded Banco do Brasil, Brazil’s oldest financial institution and one of the world’s longest-operating banks. Established to stabilize the exiled Portuguese crown’s finances and issue currency, Banco do Brasil quickly became the backbone of Brazil’s economy. From financing the nation’s first coffee exports to supporting modern agribusiness, its 217-year history reflects Brazil’s growth and resilience, making it a unique proxy for the country’s economic journey and a cornerstone for investors seeking exposure to this dynamic market.
Source: Banco do Brasil
After being liquidated in 1829, the bank was reborn in 1851 as a private entity before once again becoming a pillar of the national economy—particularly by financing agriculture, European immigration, and public finances at the dawn of the Republic. Today, Banco do Brasil remains a major force in Brazil’s economic and social development, with a strong presence in household and business lending, as well as strategic sectors, while also engaging in sustainable development and social inclusion initiatives through its foundation, established in 1985. Banco do Brasil’s history since its founding in 1808 is deeply intertwined with the economic and social development of Brazil.
You have just seen the macro potential and the 10%+ dividend promise of Banco do Brasil. However, every high-yield opportunity requires a deeper look into the risks.
The remainder of this in-depth analysis is crucial for your investment decision and is hosted on our main platform.
In the full article, we finalize the analysis, covering:
The Specific Risks: Why state ownership and credit quality could kill the dividend.
Volatily vs. Opportunity: How to use the stock’s high standard deviation to your advantage.
The Investment Plan: My personal strategy for investing an additional $1,700 in this stock.
To unlock the complete analysis, understand the risks, and see the full investment plan, click the button below to read the complete article on our website:
Liked this Deep-Dive? Buy Me a Coffee!
Your support keeps this newsletter independent and research-driven. If this analysis saved you time or gave you a new investment idea, consider making a one-time donation. Every contribution helps me maintain part of the research free and accessible to everyone.
1. In term of comparison of debt, i must point out that debt /revenue is not a fair and reasonable indicator as you overlooked one very important operational difference between PBR and all its peers: PBR is the largest offshore shore oil producer in the world, 95% of its oil production derives from offshore drilling, while all is peers are 90% onshore drilling producers. This resulted PBR has far superior profit margin, the 5 yr average EBITDA MARGIN PBR 39% while CVX XOM 19% AND TTE 19.3%, LEVERED FCFC MARGIN : PBR 20%, while CVX XOM 6%, TTE 7.6%. Therefore debt/ levered cash flow is a much fair and objective comparison, if that is the case, PBR has the lowest debt/fcf ratio of 7.39, while XOM 8.35 CVX 7.86 BP 17.63 TTE 11%.
2. I HIGHLY commend you that you point out PBR generates 70% revenue in real but most it's debts are issued in USD, THAT is the most risky geo aspect for foreign investors. The good news is the REAL is stabilised now, it has been surprisingly appreciated against USD recently. My main is about its internal political conflicts will have negative effect on its currency.
3. I am attending conference in Florida next week, will make further comments upon returning home as PBR IS my most over weighting holding in my retirement portfolio.
https://seekingalpha.com/comparison/new/MCUyQ3BiciUyQ2JwJTJDY3Z4JTJDeG9tJTJDdHRl?interval=10Y&metric=totalReturn