

I launched my 100% income portfolio 18 months ago, and the early verdict is encouraging: high yield without sacrificing total return. But I’m not popping champagne just yet. I won’t be tapping this portfolio for another decade, which means the real work is preparing for the risks ahead—not celebrating the early results. In this portfolio review, I’ll show you how I’m finalizing the I-CASH deployment and break down the framework I’m using to build a crisis-resistant retirement income stream—one that isn’t dependent on any single country, currency, or sector. But let’s get down to the numbers: my portfolio was down 0.3% in Q2 2026, following a period of euphoria.
I/ Facts: Income Without Underperformance...Until Now
A / Total Return Tracks the S&P 500 Closely since 18 months, but Underperforms Relative to the MSCI World and the Nasdaq
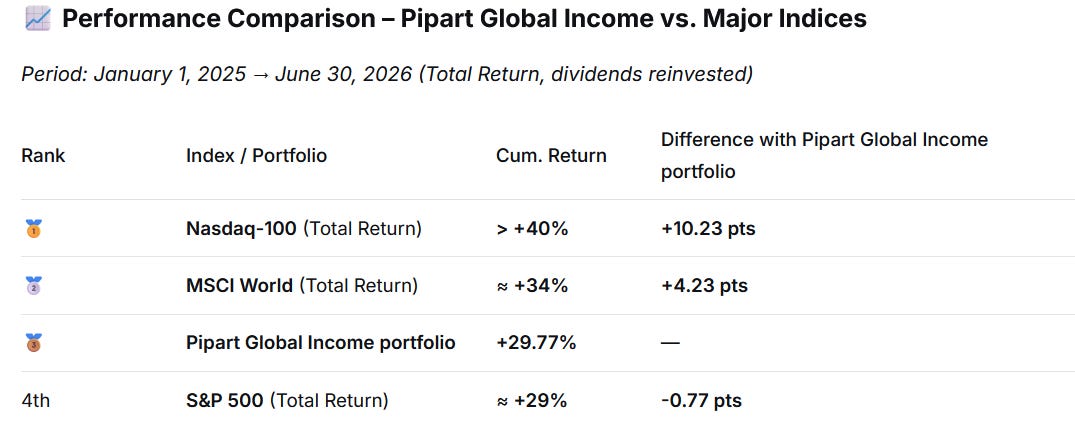
This table below captures the trade-off my portfolio is deliberately designed to make. A +29.77% total return is virtually indistinguishable from the S&P 500’s roughly +29%—a remarkable outcome for a portfolio that simultaneously distributes around a 10% cash yield. Against the MSCI World and the Nasdaq, however, I trail by roughly 4 and 10 percentage points. That’s entirely consistent with the portfolio’s objective. The MSCI World benefited from a broad international rebound, while the Nasdaq was propelled by an AI-driven technology rally—both classic growth-led environments. My portfolio isn’t built to maximize upside during speculative bull markets. It’s built to generate reliable income while maintaining competitive long-term total returns and a diversified risk profile.
B / This Quarter Was Marked by the Normalization of Oil & Gas and Tech Stocks
Indeed, Petrobras shares have normalized now that the Iran conflict has cooled down—at least for the time being. WTI prices dropped, and Petrobras followed suit. Its ability to generate dividends, however, remains remarkably high and impressive.
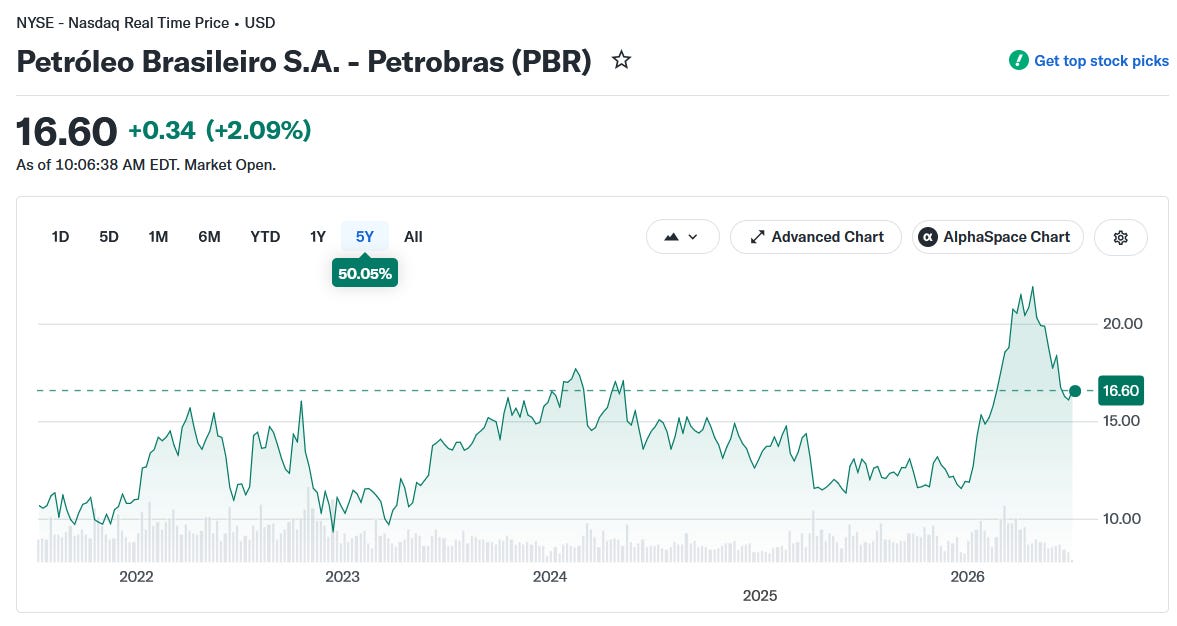
Source: https://finance.yahoo.com/quote/PBR-A/
On the tech side, however, the rebound in share prices helped cushion the decline in the portfolio’s oil holdings. JEPQ indeed regained ground following the Iranian geopolitical episode.
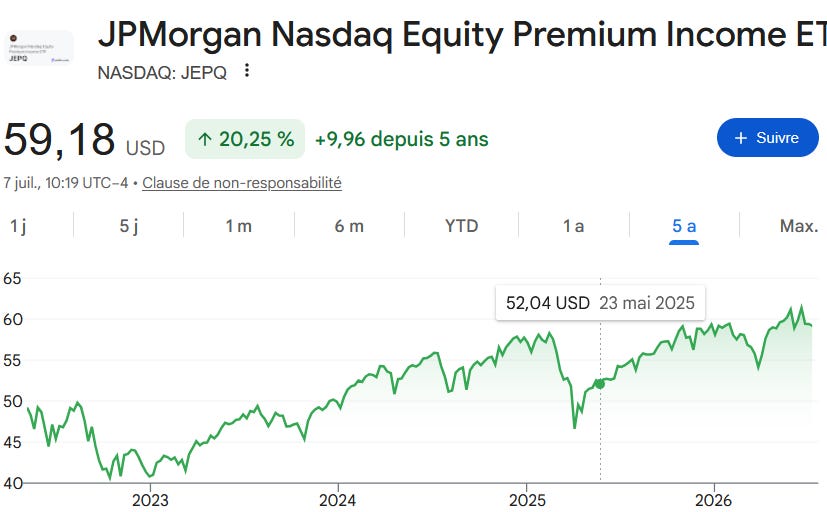
Source: Yahoo Finance
C / Portfolio Income Served as a Buffer and Continues to Increase.
The numbers behind this buffer are clear. My portfolio currently generates $9,926 in annual gross income, or $827 per month. That translates into a 10.33% yield on the current market value. But more importantly, a 13.41% yield on my original cost basis. What does that spread tell me? It tells me that the income stream isn’t just keeping pace with the portfolio’s growth; it’s actually increasing relative to what I initially put in. Even as prices fluctuated and Petrobras normalized, these cash flows never wavered. This $9,926 annual income acts as a real-world cushion: it’s the reason a -1% quarter doesn’t keep me up at night, and it’s the engine that will eventually fund my retirement. The price may consolidate, but the income marches higher. That’s precisely the point of global income investing.
Below are the exact financials of my experimental portfolio. I put $74,000 into it back in January 2025. That’s a substantial sum for much of the world’s population, yet a modest one for seasoned investors. And that’s precisely the point: to make income investing accessible, offer tangible benchmarks, and, above all, see how this portfolio weathers the storms over the long haul.

II / My Portfolio Remains Under-Diversified, but Reinvestment Is the Cure
A/ The I-CASH Method drives the strategy
We stick to the method (Investing in One Country Could Sink Your Portfolio – Part 2 - Pipart Global Income 10%+ Yield) with patience and discipline, and we draw the consequences. That’s the key. Obviously, after 18 months, we can’t yet mechanically apply the logic because there are still many imbalances.
The I-CASH Method remains my compass:
Internationalization
Currency diversification
Asset Class diversification
Sector diversification
High Yield
So let’s start with the “I” for Internationalization. Although I have a notable presence in the United States, the United Kingdom, China, and Brazil, my internationalization remains insufficient. Exposure to Asia is too heavily concentrated on China, with limited diversification into other major Asian markets. Furthermore, I have no presence in Canada or Australia — two stable and attractive economies — and my coverage of emerging markets is still too limited. This geographic distribution lacks the maturity and diversification needed to better withstand regional shocks and capture global growth opportunities.
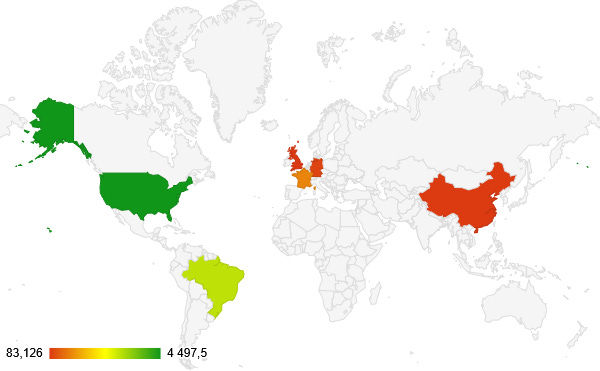
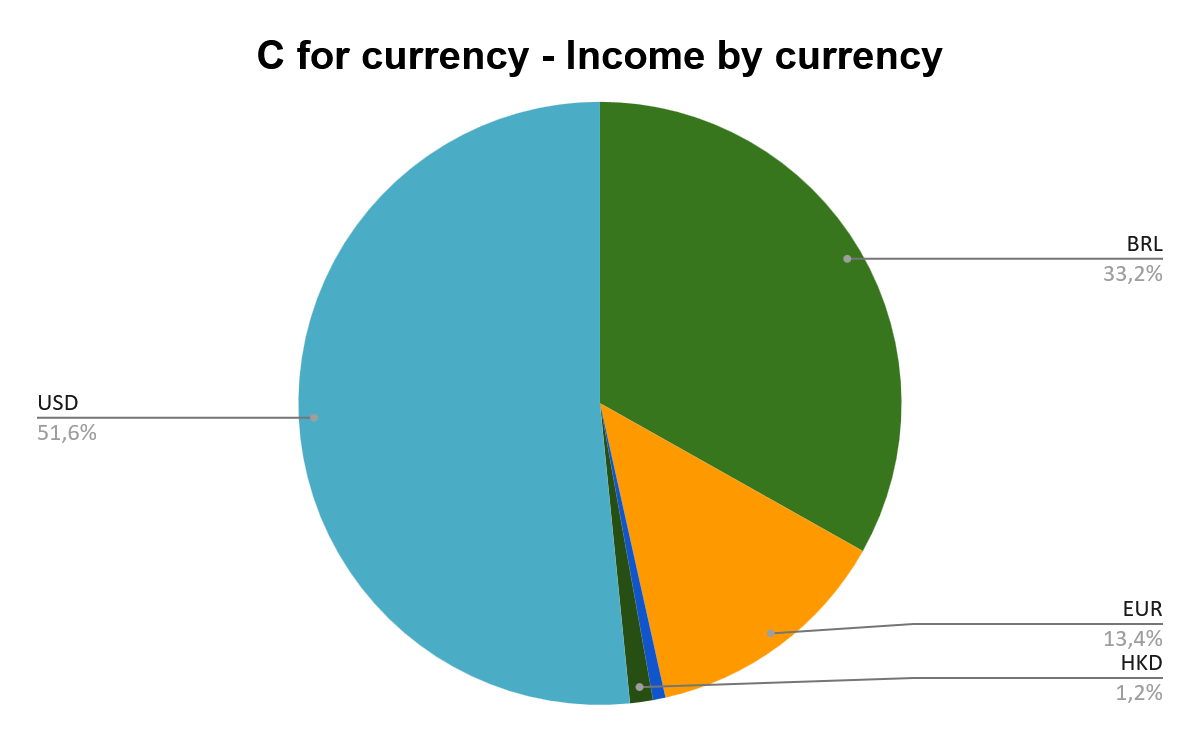
C for Currency Diversification. On this front, the chart below tells us two things. First, the USD remains too dominant (51.6% of income), followed closely by the Brazilian real (33.2%). While the euro now represents a more meaningful 13.4%, overall currency diversification is still insufficient. At this stage, I believe I need to further increase the share of euro-denominated income as a priority, before pursuing broader international diversification. That remains my clear focus for 2026: first strengthen the balance among major currencies (USD, EUR, and BRL), then gradually expand into other regions.
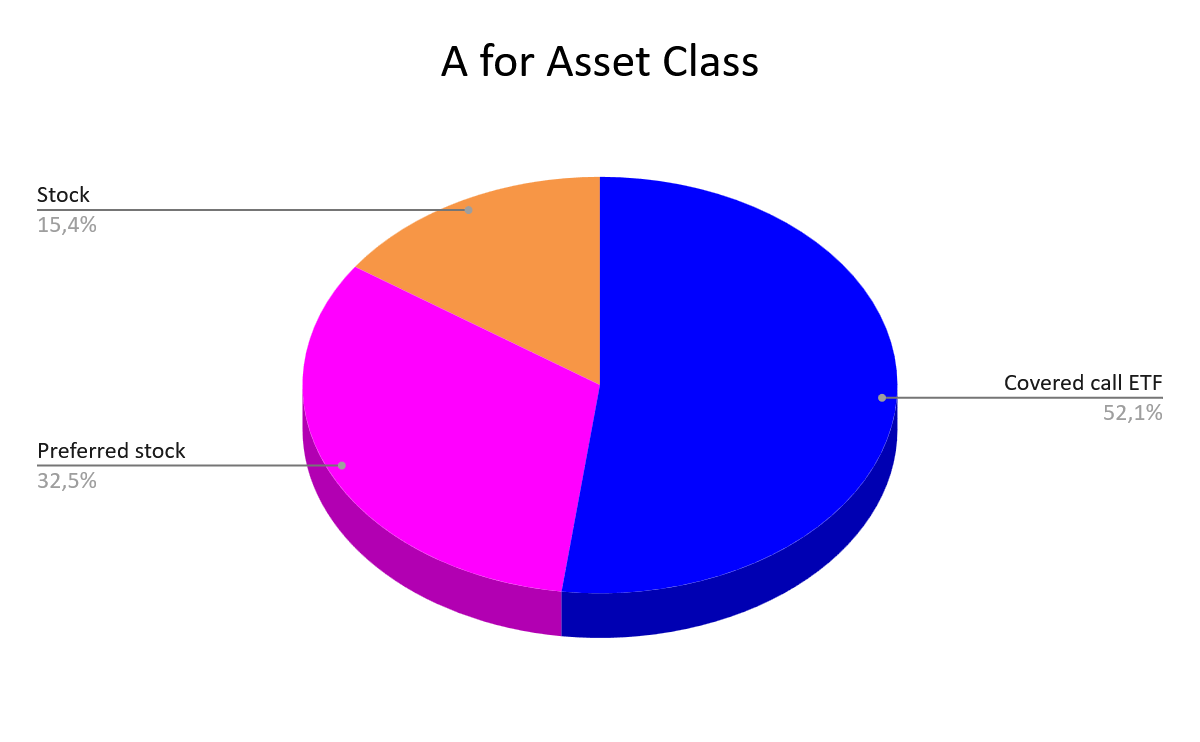
A for Asset Class. The verdict on asset allocation is clear: I have become far too concentrated in Covered Call ETFs, which now represent 52.1% of the portfolio. While I readily admit that this strategy has served me very well since the inception of the portfolio, the exposure is now excessive. Preferred stocks (32.5%) and regular stocks (15.4%) complete the allocation, but the overall balance lacks diversification
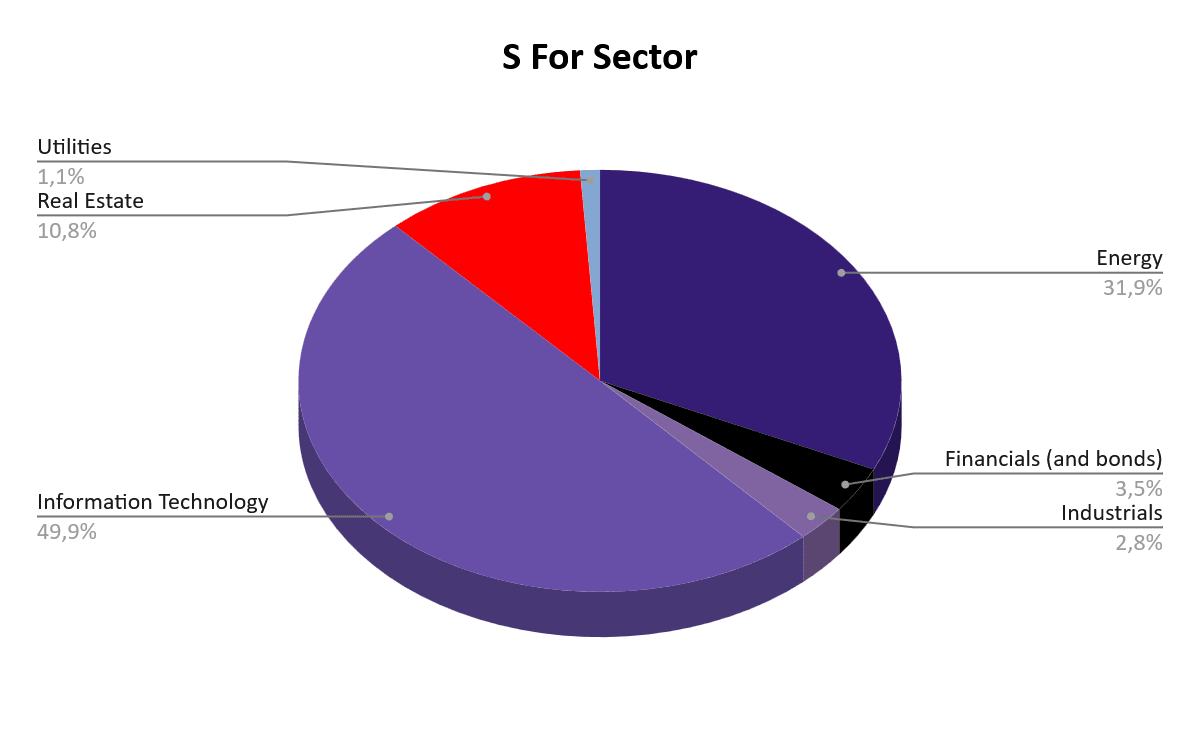
S for Sector. Here again, the concentration is obvious: Information Technology (49.9%) and Energy (31.9%) together dominate the portfolio. These two initial bets have paid off handsomely and remain solid long-term convictions. I have no intention of selling existing positions unless truly exceptional opportunities arise. Going forward, all new dividends and fresh capital will therefore be allocated to everything except these two sectors. This approach allows us to clearly sketch the future direction of the portfolio and its rebalancing priorities. H for High Yield raises no particular concerns. It’s time to act, as concrete buying decisions will need to be made starting next week.
In conclusion, the imbalances remain unchanged from last quarter, while the metrics are improving slowly but steadily. My only structural issue remains my heavy reliance on covered call ETFs. I can’t resolve this overnight, but it doesn’t pose a problem during this accumulation phase. Either way, with a dividend reinvestment strategy, these imbalances are gradually working themselves out. It takes years to reach the final goal—which is fine, since I still have a few years ahead of me.
B/ A Few Words About Dividend Reinvestment
Over the past three months, I reinvested the dividends into DYLD (Eurozone industrials), Volta Finance (Eurozone CLOs), and BXSL (US private credit). This allowed me to rebalance the portfolio to boost my euro-denominated income while adding a BDC that’s currently trading at attractive valuations. Ultimately, it increased my overall income and reinforced its durability by expanding the number of shares and ETFs I hold.
Looking ahead to the coming months, my assessment remains unchanged. The same issue persists: I still don’t see any compelling opportunities in Asia or emerging markets right now. So I’ll keep searching, but sector and currency diversification will remain my top priorities for the next quarter.
It’s time to test another European ETF: SYLD (Global X Euro Stoxx 50 Covered Call UCITS ETF). This fund applies a covered call strategy on the Euro Stoxx 50, delivering a double-digit dividend yield while maintaining exposure to Europe’s largest and most established companies. It offers a well-balanced sector allocation with strong weights in Financials (21%), Consumer Discretionary (19%), Industrials (17%), and Technology (16%). Denominated in euros, SYLD will help me increase my European exposure.
Investment Takeaway
Those who have read the whole article deserve a ‘present’: the list of my holdings. In terms of price return only, the clear winners in my portfolio are Petroleo Brasileiro (PBR.A) with a very strong +27% and Legal & General (LGGNY) at +25%, supported by solid performances from JEPQ (+15%) and XYLD (+8%). On the losing side, we have Edvantage Group (-71%), Icade (-8%), NATY (-5%), PFFI (-4%), and JEPG (-4%), while DYLD is flat. Ultimately, my only real disappointments are Icade and especially Edvantage Group. These two underperforming positions are not particularly concerning at this stage, as I still fully stand by my long-term investment thesis on both.
Now let’s turn to the bottom line. Over the past 18 months, I have good total return results: the portfolio is up +29.77% since January 2025. Honestly, just tracking the S&P 500 closely already felt like an ambitious target. Strategy and luck worked hand in hand, at least until Q2, which delivered a modest -0.3% pullback and brought things back down to earth.
The portfolio’s CAGR since inception currently stands at roughly 19% (on a 29.77% total return over 18 months). The goal right now is to grow the income and make it more resilient. Because this is an income portfolio. And I don’t intend to rely on luck to get me there.”