

I know I won’t always be able to brag about results like these, because beating the market isn’t the purpose of a global income portfolio, but I still tell myself it would be a shame not to enjoy it. And after all, I’ll look back at this article on the bad days when I see my portfolio melting down in a bear market. But whatever, we’re living in the moment, and this is a great performance. Anyway, let’s look at the numbers and accept that, with only 21 months of track record, this is just the beginning: a total return of +42.52% since inception (january 2025) and +9.82% for Q3 2026. The portfolio is posting strong performance again.
I/ Facts: Income with Outperformance...Until Now
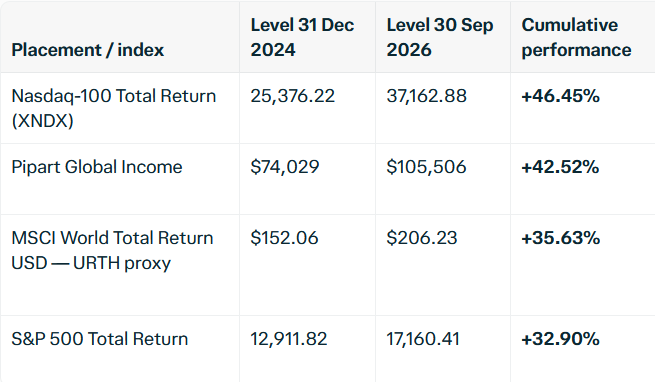
A / Total Return Outperforms All Indexes Except Nasdaq 100
An analysis of these figures is highly satisfying. The Pipart Global Income portfolio has achieved a cumulative performance of +42.52%, successfully outpacing broader market benchmarks, including the S&P 500 (+32.90%) and the MSCI World (+35.63%). Although the portfolio trails the Nasdaq-100 (+46.45%), it is important to note that a global income strategy is not designed to compete with a highly concentrated, technology-heavy index. The fact that the portfolio holds its own and outperforms standard benchmarks is a welcome validation of the strategy. I will certainly retain these figures for future reference during periods of market downturn, as a reminder of the strategy’s underlying effectiveness.
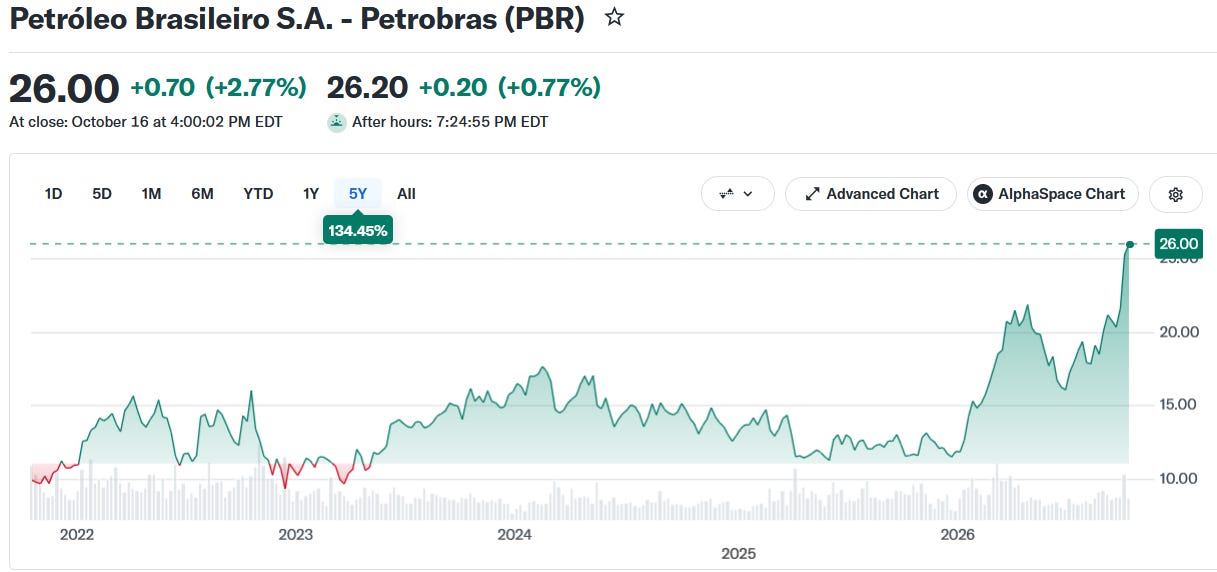
B/ The oil and gas sector’s outperformance was a defining feature of this quarter
The portfolio’s gains were primarily driven by Petrobras. My long-term view has always been bullish. I have stated this before, and I still firmly believe it. Oil is not an energy source of the past, and Petrobras’s positioning in deepwater oil is excellent. However, the portfolio as a whole also held up well, and the income machine fully played its role: I was able to diversify my portfolio by consistently applying the I-CASH model as rigorously as possible. I am still not sufficiently diversified, but the situation is steadily improving.
Source: Yahoo Finance
C / Portfolio Income Served as a Diversifier and Continues to Increase
The numbers behind this buffer are clear. My portfolio currently generates 10,249 USD in annual gross income, or 854 USD per month. Since the last quarter alone, my annual income has grown by $323, and while capital appreciation naturally compressed the yield on market price to 9.71%, my yield on cost actually climbed to 13.85% on my original investment. What does that spread tell me? It tells me that the income stream isn’t just keeping pace with the portfolio’s growth; it’s actually increasing relative to what I initially put in. Even as prices fluctuated, these cash flows never wavered. This annual income acts as a real-world cushion: it’s the reason a -1% quarter doesn’t keep me up at night, and it’s the engine that will eventually fund my retirement. The price may consolidate, but the income marches higher. That’s precisely the point of global income investing.
Below are the exact financials of my experimental portfolio. I put $74,029 into it back in January 2025. That’s a substantial sum for much of the world’s population, yet a modest one for seasoned investors. And that’s precisely the point: to make income investing accessible, offer tangible benchmarks, and, above all, see how this portfolio weathers the storms over the long haul.

II / My Portfolio Remains Under-Diversified, but Reinvestment Does The Job
We stick to the method (Investing in One Country Could Sink Your Portfolio – Part 2 - Pipart Global Income 10%+ Yield) with patience and discipline, and we draw the consequences. That’s the key. Obviously, after 21 months, we cannot yet mechanically apply the logic because there are still many imbalances.
The I-CASH Method remains my compass:
Internationalization
Currency diversification
Asset Class diversification
Sector diversification
High Yield
I for Internationalization
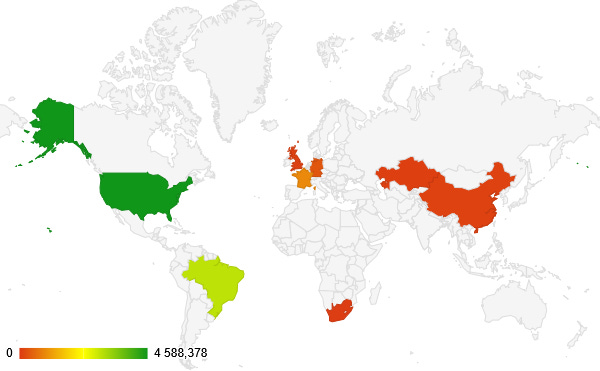
So let’s start with the “I” for Internationalization. Although I have a notable presence in the United States, the United Kingdom, China, and Brazil, my internationalization remains insufficient. Exposure to Asia is too heavily concentrated on China, with limited diversification into other major Asian markets. Furthermore, I have no presence in Canada or Australia — two stable and attractive economies — and my coverage of emerging markets is still too limited. But the good news is, I’ve opened several new positions: a Singaporean company (BW LPG Ltd), an African bond ETF, and a bank from... Kazakhstan (Halyk). Anyway, this geographic distribution still lacks the maturity and diversification needed to better withstand regional shocks and capture global growth opportunities.
C for Currency Diversification
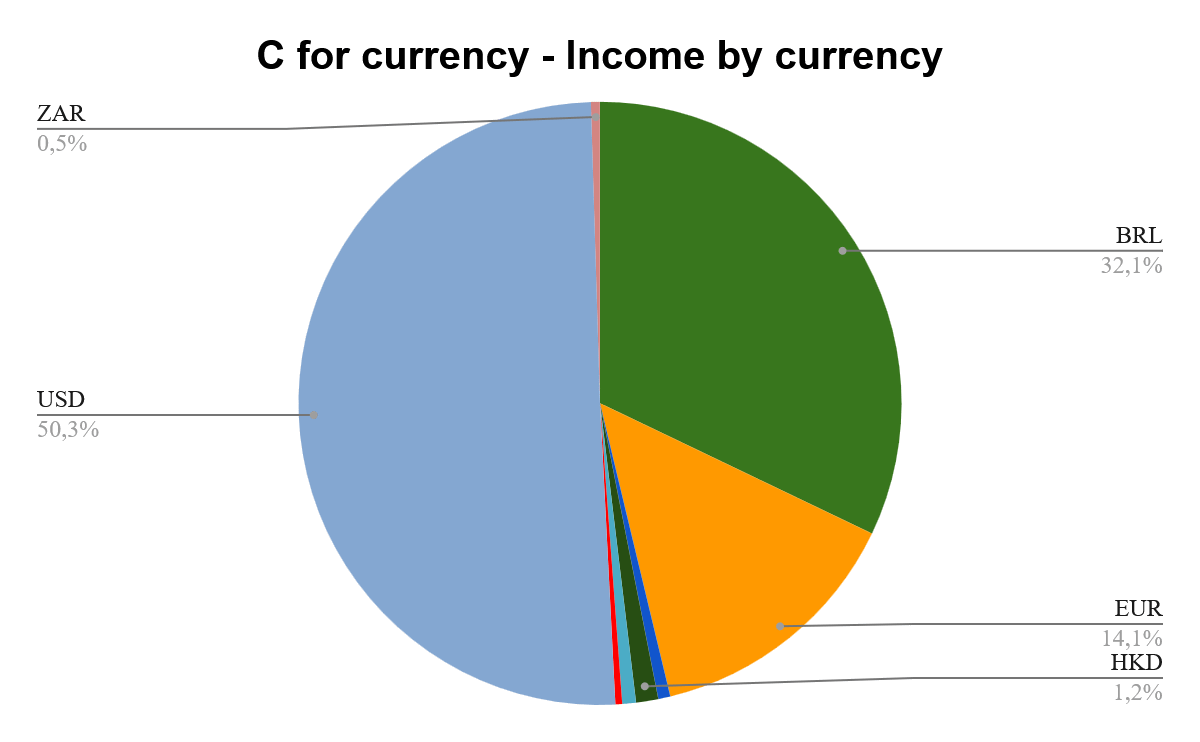
On this front, the chart below tells us two things. First, the USD remains too dominant (50.3% of income), followed by the Brazilian real (32.1%). While the euro now represents a more meaningful 14.1%, overall currency diversification is still insufficient. The remaining 3.5% is spread across a mix of other currencies, notably HKD (1.2%) and ZAR (0.5%), alongside smaller positions in GBP, KZT, and SGD. At this stage, I believe I need to further increase the share of euro-denominated income as a priority, before pursuing broader international diversification. That remains my clear focus for 2026 and 2027: first strengthen the balance among major currencies (USD, EUR, and BRL), then gradually expand into other regions.
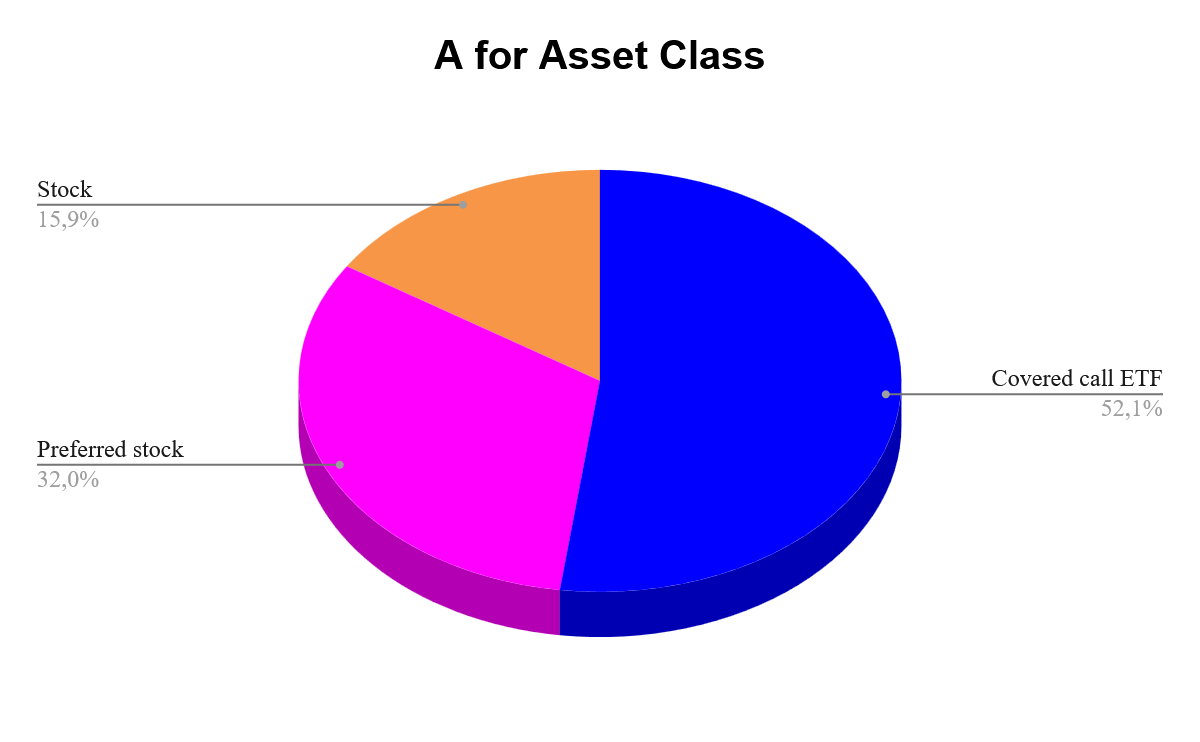
A for Asset Class
The verdict on asset allocation is clear: I have become far too concentrated in covered-call ETFs, which now represent 52.1% of the portfolio. While I readily admit that this strategy has served me very well since the inception of the portfolio, the exposure is now excessive. Preferred stocks (32.0%) and regular stocks (15.9%) complete the allocation, but the overall balance lacks diversification.
S for Sector
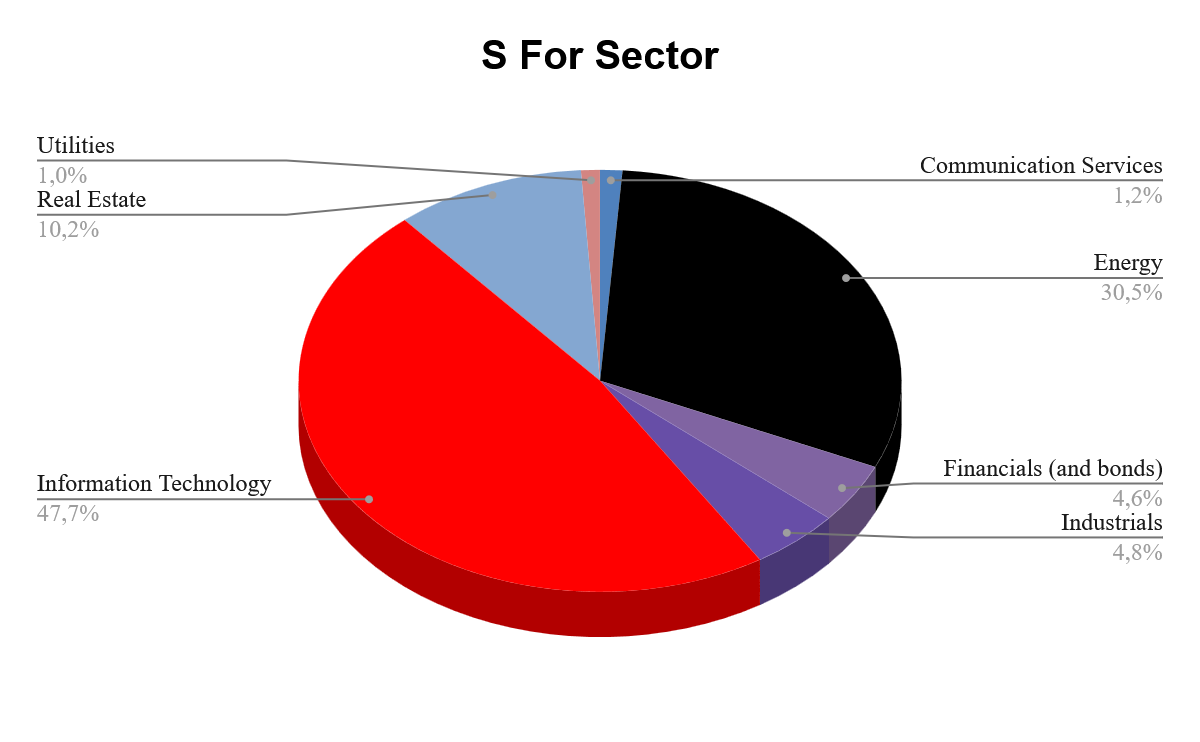
Here again, the concentration is obvious: Information Technology (47.7%) and Energy (30.5%) together dominate the portfolio. However, compared to the previous quarter, their combined weight has slightly decreased from 81.8% to 78.2% (with IT dropping from 49.9% and Energy from 31.9%). These two initial bets have paid off handsomely and remain solid long-term convictions. I have no intention of selling existing positions unless truly exceptional opportunities arise. Still, this slight shift shows that my strategy is slowly starting to take effect, as sectors like Real Estate (10.2%), Industrials, and Financials are gradually picking up the slack. Going forward, all new dividends and fresh capital will therefore be allocated to everything except these two sectors. This approach allows us to clearly sketch the future direction of the portfolio and its rebalancing priorities.
H for High Yield raises no particular concerns.
But enough theory. Let’s look at what this actually means in practice with the full list of my holdings.
INVESTMENT TAKEAWAY
For those who journeyed through this entire review, a reward awaits: the full unveiling of my holdings.
On the price return front, the undisputed star of the quarter was Petrobras, propelling the portfolio to its 9.82% quarterly triumph, flanked by JEPQ and Legal & General. Yet, every portfolio has its disappointments. Edvantage Group and Icade were clearly not my best picks, but I still fully stand by my long-term thesis on Icade.
But a mere list of tickers doesn’t tell the whole story—the I-CASH philosophy is written in the currency footprint of these assets:
The international bedrock, our dominant engine, houses a heavy covered-call arsenal (JPMorgan, YieldMax, Infrastructure Capital) alongside Brazilian heavyweights (Petrobras, Banco do Brasil), BXSL, and Legal & General. More importantly, it is the staging ground for our newest geographic conquests: Singapore’s BW LPG, Kazakhstan’s Halyk Bank, and an African bond ETF.
The Eurozone pillar is steadily gaining weight, anchored by French real estate (Icade), the credit dynamics of Volta Finance and our german industrial play (DYLD).
Finally, Hong Kong’s Edvantage stands as our solitary Asian currency outpost.
Now, let’s turn to the bottom line. Over the past 21 months, the portfolio has delivered an exceptional +42.52% total return. While I know a global income strategy isn’t designed to consistently “crush the market” as it did this quarter, I’ll gladly take the win. The income engine is humming louder than ever, generating $10,249 annually with a yield on cost of 13.85%.
The true victory, however, is the execution. By deploying fresh capital into Singapore, Africa and Kazakhstan, and by easing our sector concentration, the I-CASH method is breathing life into the portfolio. It is slowly becoming more resilient and more global. The goal remains to keep nurturing this income stream, because this is an income portfolio. And I don’t intend to rely on luck to get me there.